Topic Insights
This reference describes the topic insight metrics and filters available in Self-Service, and where each one appears.
Goal |
Understand a topic’s behaviour from its insight metrics. |
Audience |
Topic Owners and users with viewer access to the topic. |
When to use |
Use this reference when interpreting a topic’s insights or choosing filters in the Insights tab. |
Insights on the Topic Card
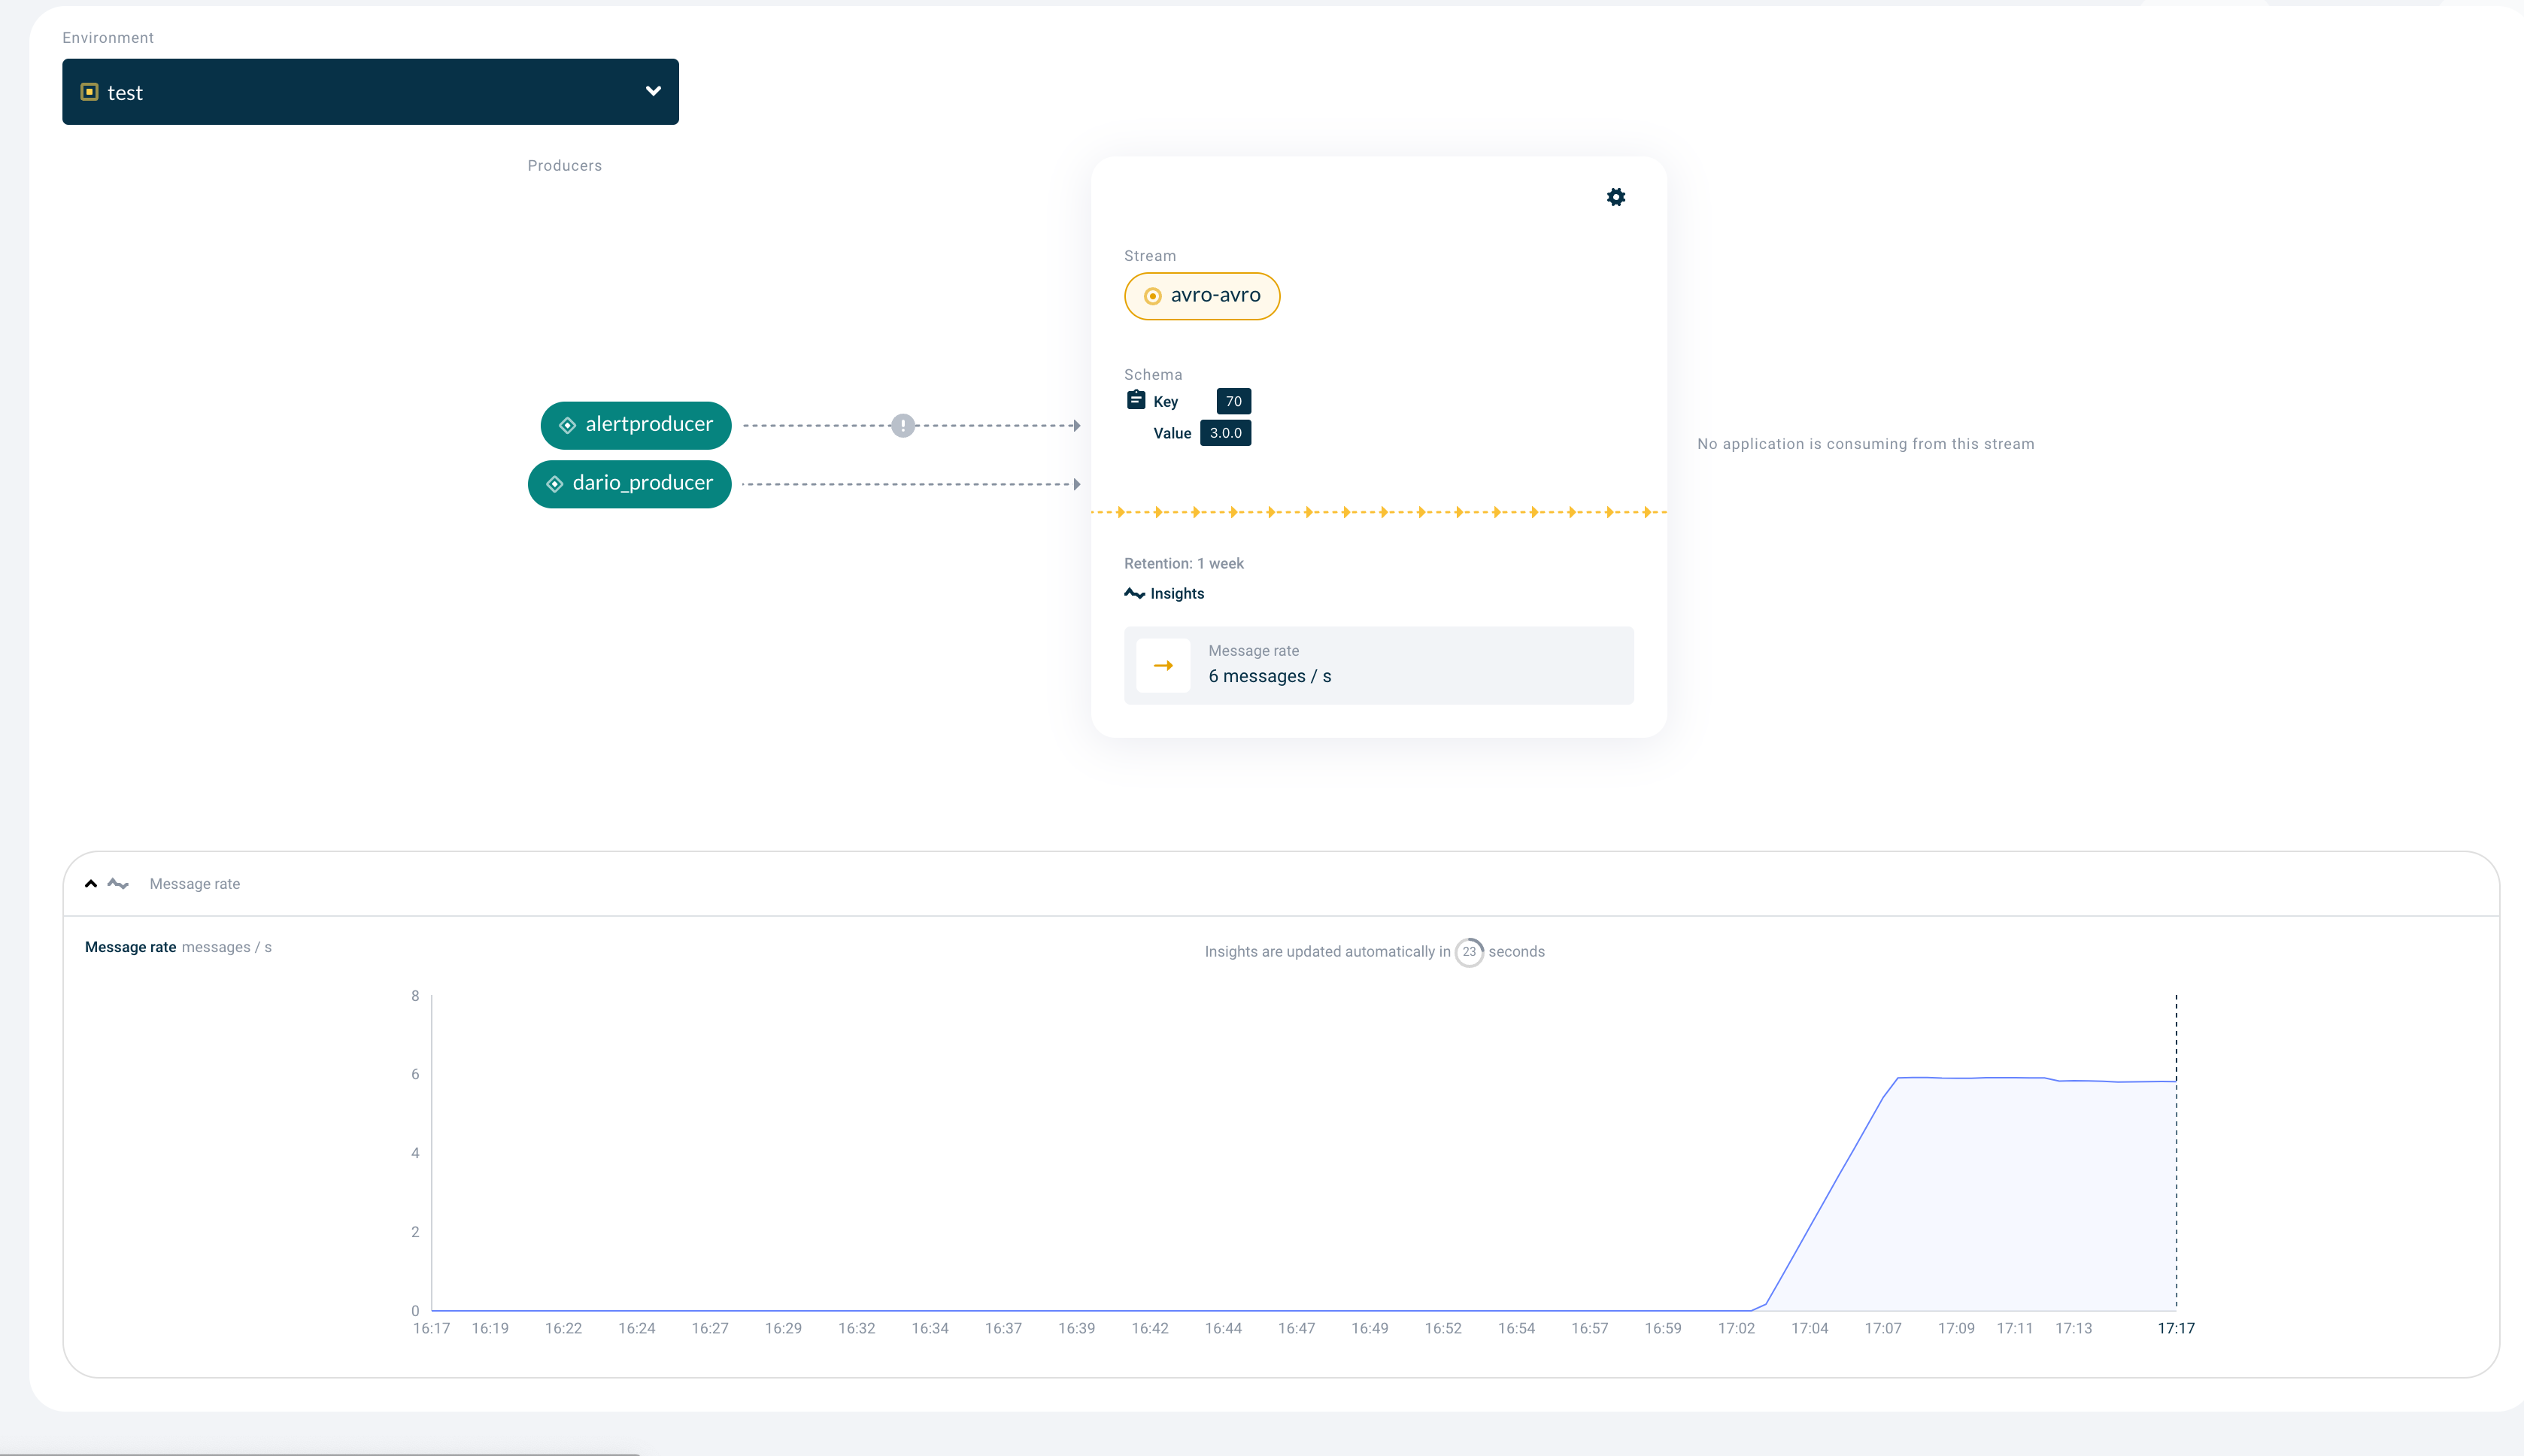
When insights are enabled for a configured topic, the message rate appears on the Topic Card, with a message-rate graph below the card:
Detailed Insights
The Insights tab shows more granular metrics and the filters that control them:
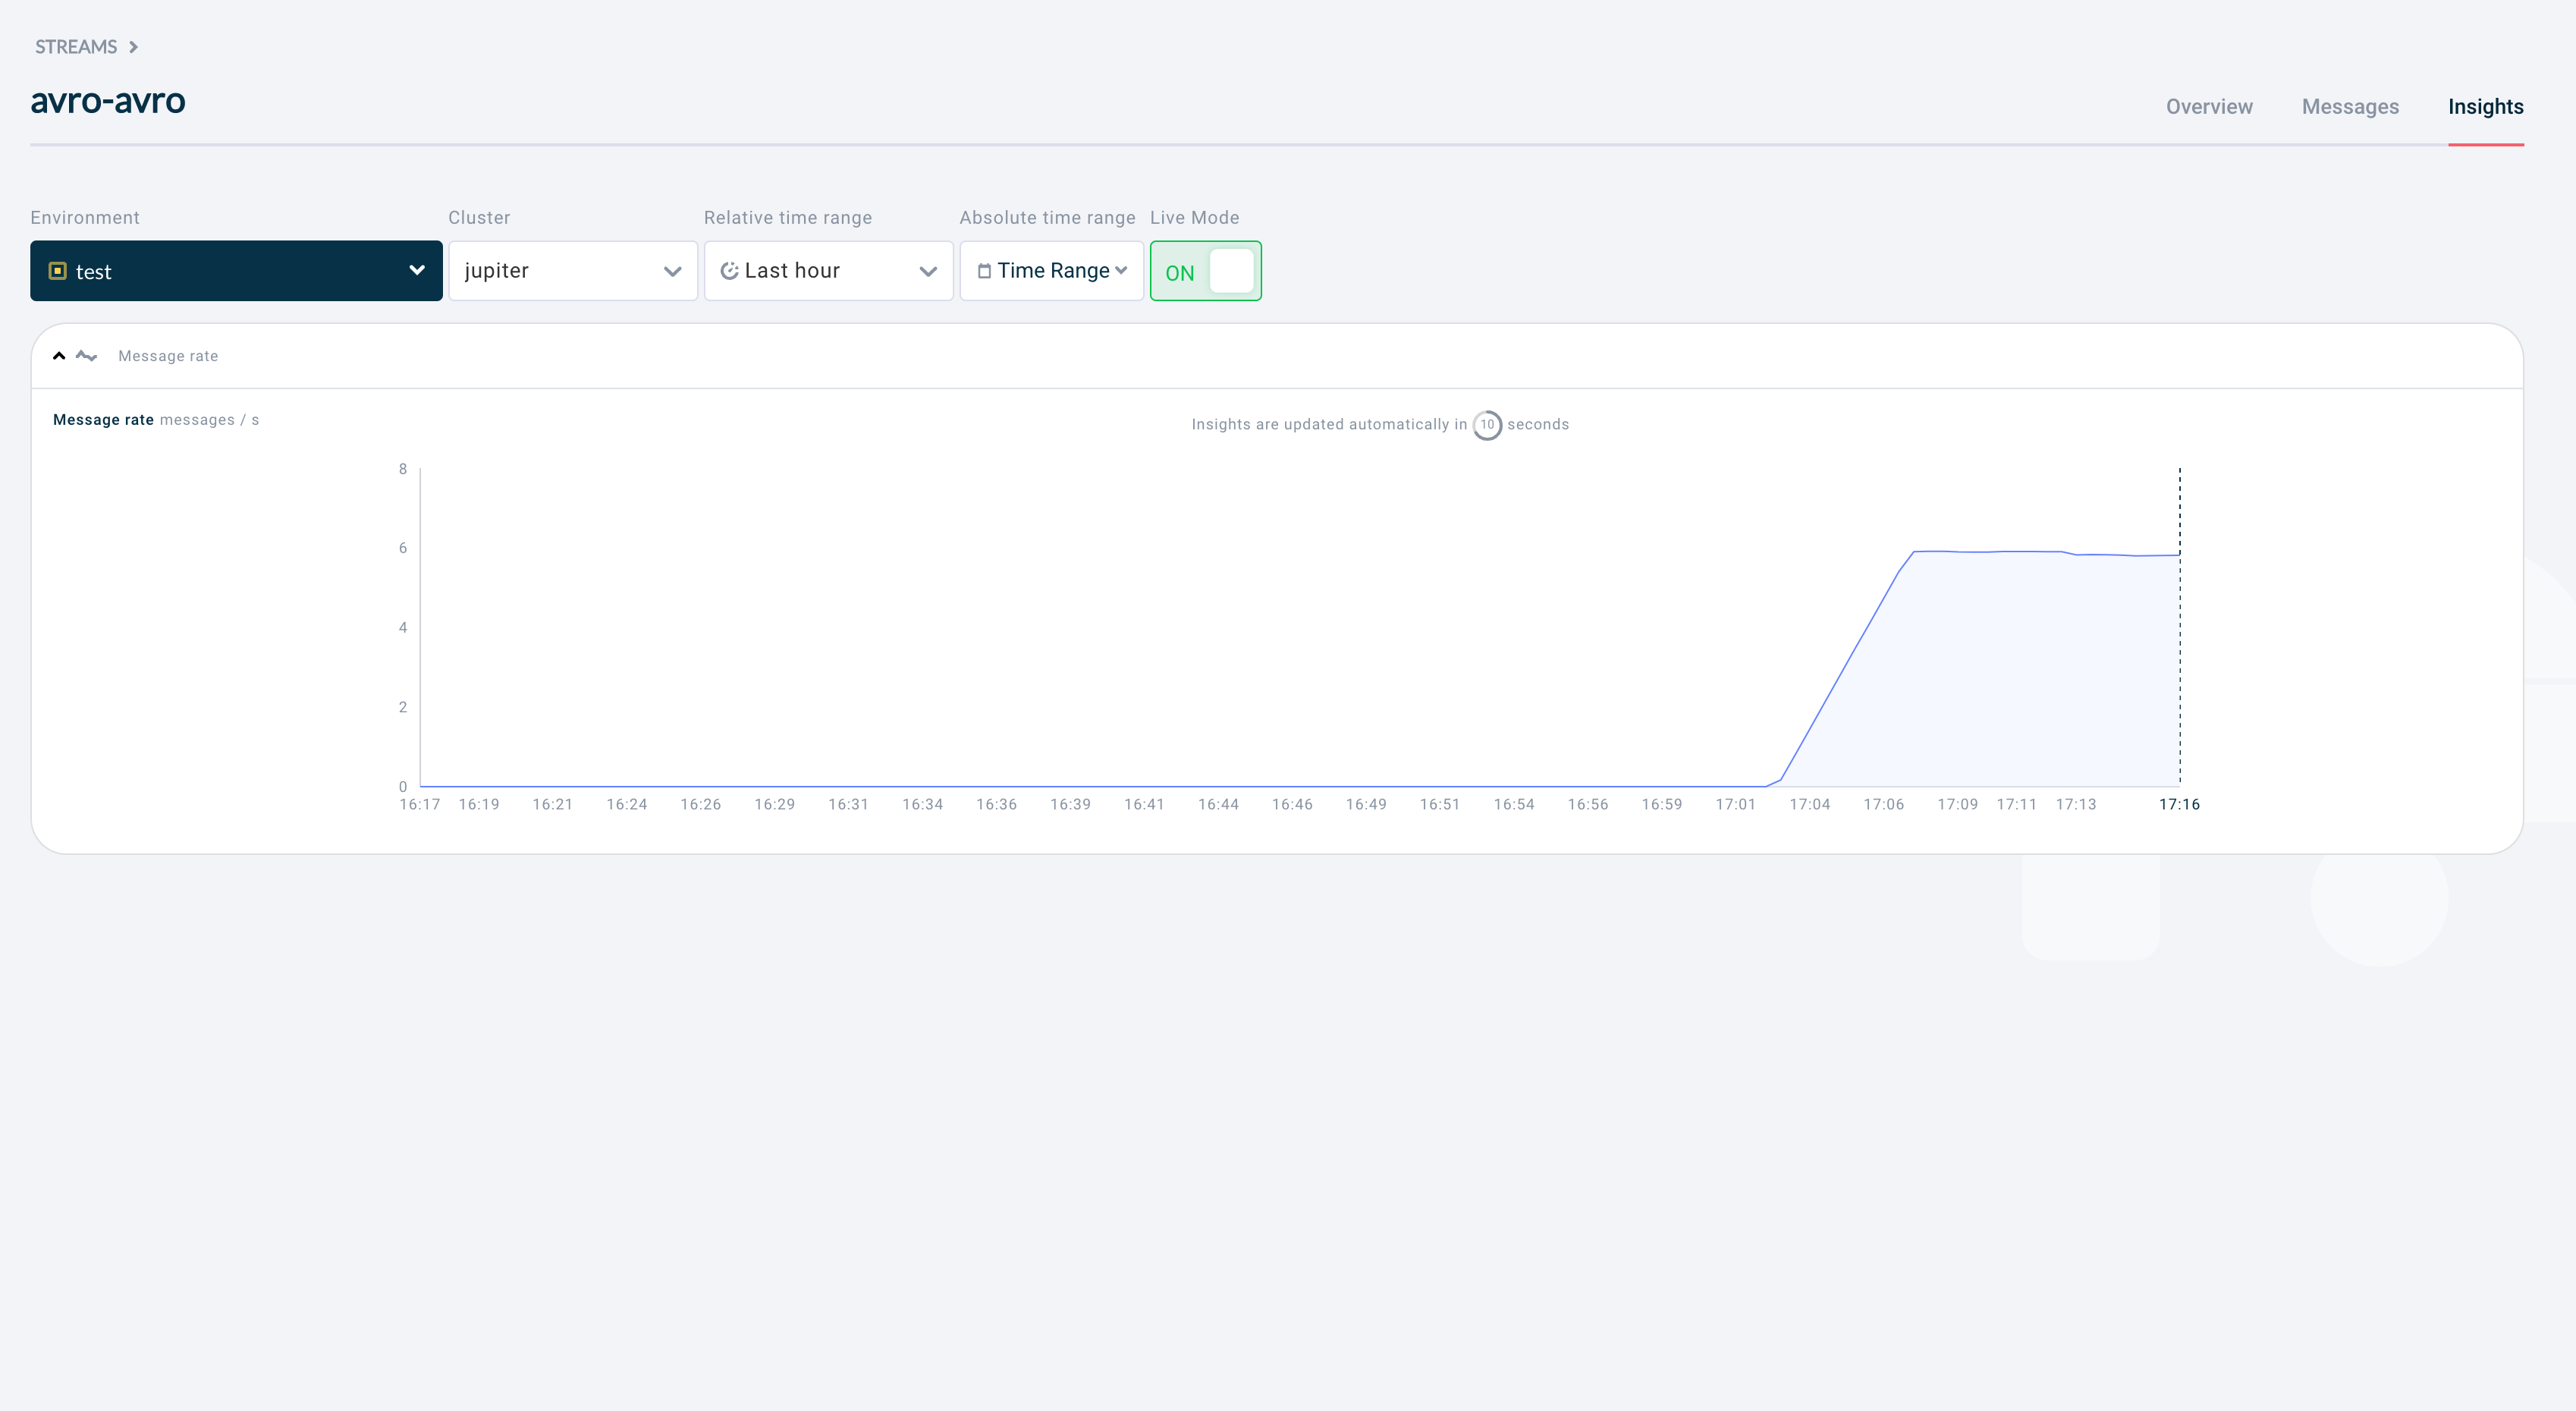
The following metrics are available in the Insights tab:
-
Message Rate: The rate of messages for the selected topic.
The following filters are available in the Insights tab:
-
Environment: The environment for which metrics are shown.
-
Cluster: The cluster for which metrics are shown.
-
Time Filters: The time range for which metrics are shown.
-
Relative Time Range: A time range from a preset option ending now.
-
Absolute Time Range: A fixed date and time range.
-
-
Live Mode: Toggles periodic updates of the graph.
| The filters apply to all available metrics. |