How to Search Logs in Kibana
This guide shows you how to pick the right Elasticsearch index in Kibana, narrow a log stream down with filters, and read the fields an Axual log line carries.
Type |
How-to guide |
Goal |
Find the log lines relevant to a problem. |
Audience |
Anyone with access to the Kibana instance the cluster’s logs are collected into. |
When to use |
Use this guide while diagnosing an incident, to get from a whole index down to the lines that matter. |
The screens below are Kibana, the query front end of the Elasticsearch, Fluentd and Kibana (EFK) stack the Axual cloud runs. A different central stack has different screens, but the fields to filter on are the same, because they come from the log lines rather than the tool.
Prerequisites
Confirm the following before you begin.
Access and permissions required
You need the following access and permissions:
-
Access to the Kibana instance, with read access to the log indices.
Resources that must exist before starting
The following must already exist:
-
Logs arriving in Elasticsearch. How to Ship Logs to a Central Stack covers getting them there.
-
The name of the index your logs land in. Index names are chosen per deployment, so ask the team that runs the stack.
Select the log index
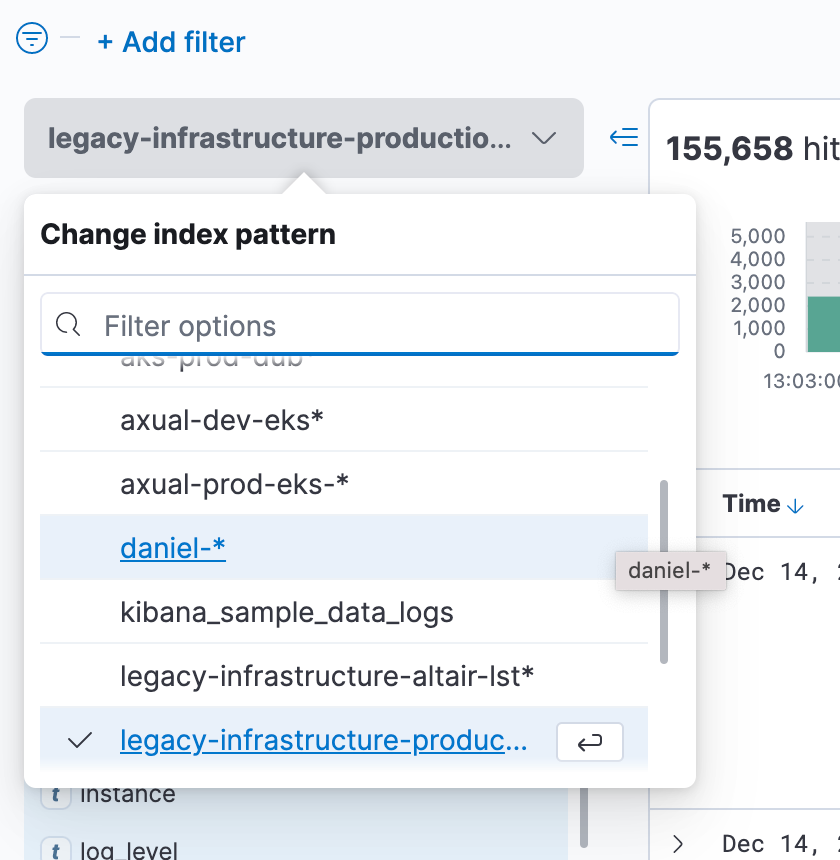
Open Kibana and choose the index holding the logs you want from the drop-down on the left of the screen. Nothing is shown until an index is selected.
Narrow the stream with filters
A log index holds every service’s output, so a useful search is mostly a matter of filtering. Start with time, then add fields.
-
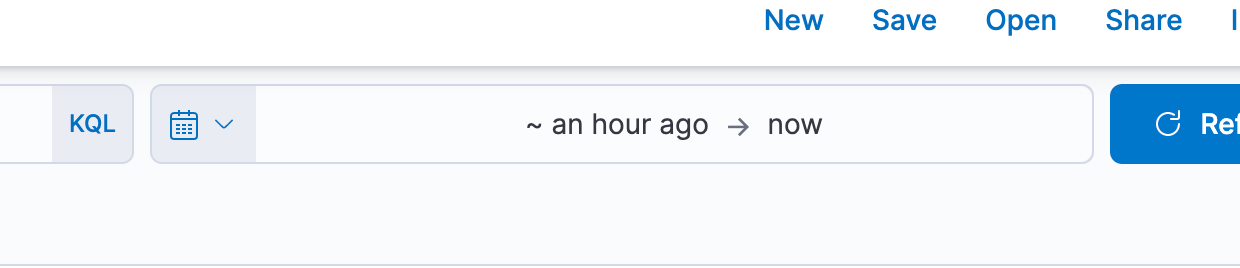
Set the time range from the filter at the top of the window. Half an hour to an hour of activity is the usual starting point, narrowing to about five minutes either side of a reported incident.
-
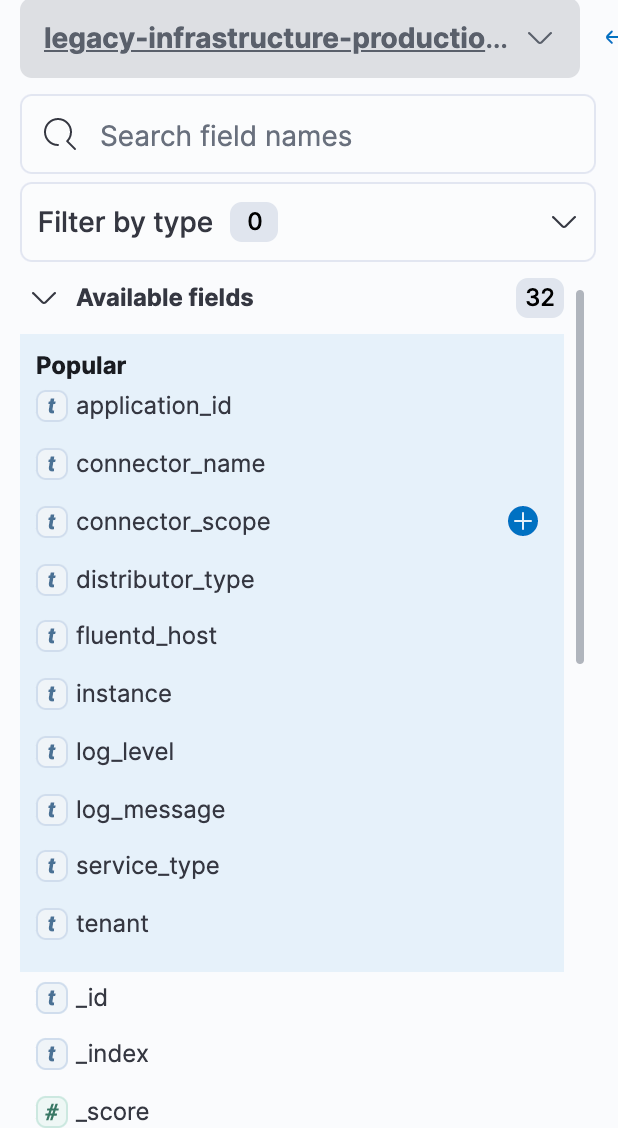
Click a field on the right of the screen to filter on it. The popup lists the unique values that field held in the last 500 messages, and choosing one filters the stream to it.
-
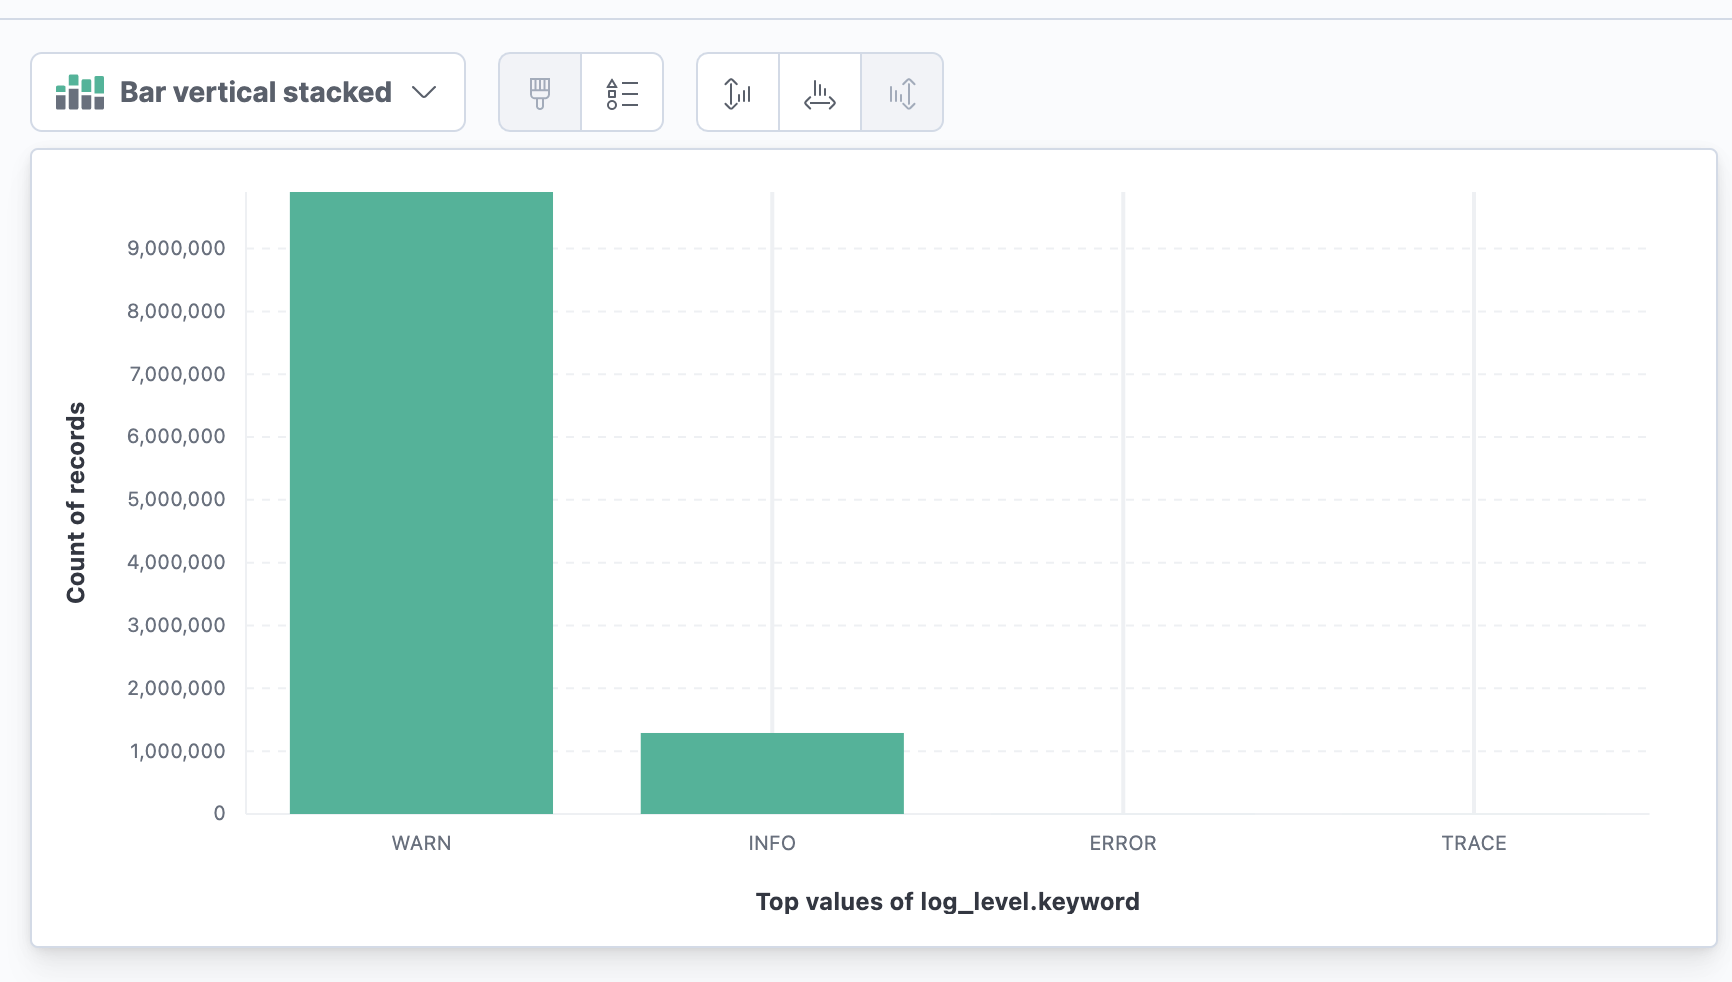
Click the field and then Visualize when the value you want is not in those 500 messages. That screen lists every distinct value the field took across the whole time range.
-
Type directly into the search input for an ad-hoc filter, using a colon for equals, as in
log_level: ERROR.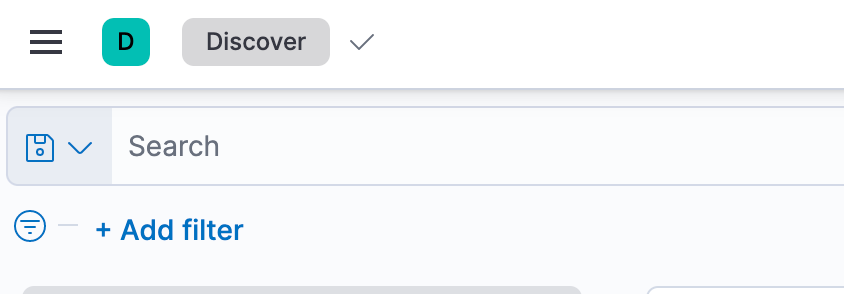
The fields worth filtering on first are these:
-
log_level: one of DEBUG, ERROR, INFO, TRACE, WARN. -
service_type: the name of the Axual service, such asbrokerorconnect. -
container-name: the name of the Kubernetes container. -
tenant: the tenant the error occurred for. -
remote_host: the host the connection came from.
The Kibana query language handles more than one filter at a time in the Discover tab, and it requires AND and OR in capitals.
|
Verify the filter narrowed the stream
A filter that never applied looks the same as a quiet system: both show few lines. Confirm the result set changed before concluding anything from it.
Check three things once the filter is in place:
-
The number of matching documents Kibana reports falls below the count the index showed unfiltered.
-
Every row still listed carries the field you filtered on, holding the value you chose, such as
log_level: ERROR. -
The time range still covers the incident. A filter that matches nothing returns an empty result, and so does a correct filter pointed at the wrong hour.
An empty result over a time range you know holds activity means the field name or the value is wrong. Clear the filter, click the field on the right of the screen again, and pick the value from the list Kibana offers rather than typing it.
A filter that found a real problem is worth keeping. How to Alert on a Log Pattern in Kibana turns one into a Watcher alert, so the next occurrence reaches someone instead of waiting to be searched for.