Viewing Application Logs
This guide shows you how to open the log console of a running application, follow and search its output, narrow it by scope, severity and worker, choose how much earlier output to load and what each line shows, and copy or download the result.
Type |
How-to guide |
Goal |
Read the live logs of a running KSML application or connector application from Self-Service, and find the reason a connector never started. |
Audience |
An application owner, a member of the group that owns the application. A user holding the Application Admin role can read the logs of any application in the tenant. |
When to use |
Use this guide when an application is failing, produces unexpected results, or reports a state you want to explain. |
Prerequisites
Complete the following before you start.
Access and permissions:
-
Membership of the group that owns the application, which is what grants access to its logs.
-
Or the Application Admin role, which reads the logs of any application in the tenant.
A connector is no different: its own owner group governs its logs, whichever Kafka Connect cluster it runs on. Being in the cluster’s Owner Group or an Authorized Group lets you deploy connectors there, and does not by itself let you read the logs of a connector another group owns. See Group authorization for Kafka Connect clusters.
Resources that must exist first:
-
An application deployment that has been started in the environment you want to read. A deployment that was never started has no logs of its own.
-
For a connector application, a Kafka Connect cluster whose Connect log viewer URL is set. Without it the platform has nowhere to read logs from, and the Logs button stays disabled. Ask a Tenant Admin or a member of the cluster’s owner group to add it, following Registering a Kafka Connect cluster to the Instance Cluster.
| Connector applications that still run on Axual Connect keep their own Logs tab, which searches a Kafka logging topic instead of streaming from the cluster. For those, follow Viewing Connector logging instead. |
Open the log console
The log console shows the lines an application writes while it runs, for one environment at a time.
-
Open the detail page of the application.
-
Select the environment whose logs you want to read.
-
Click the Logs button on the application card.
The console opens and starts streaming. The header shows Live while lines are arriving, and Stopped once the stream ends.
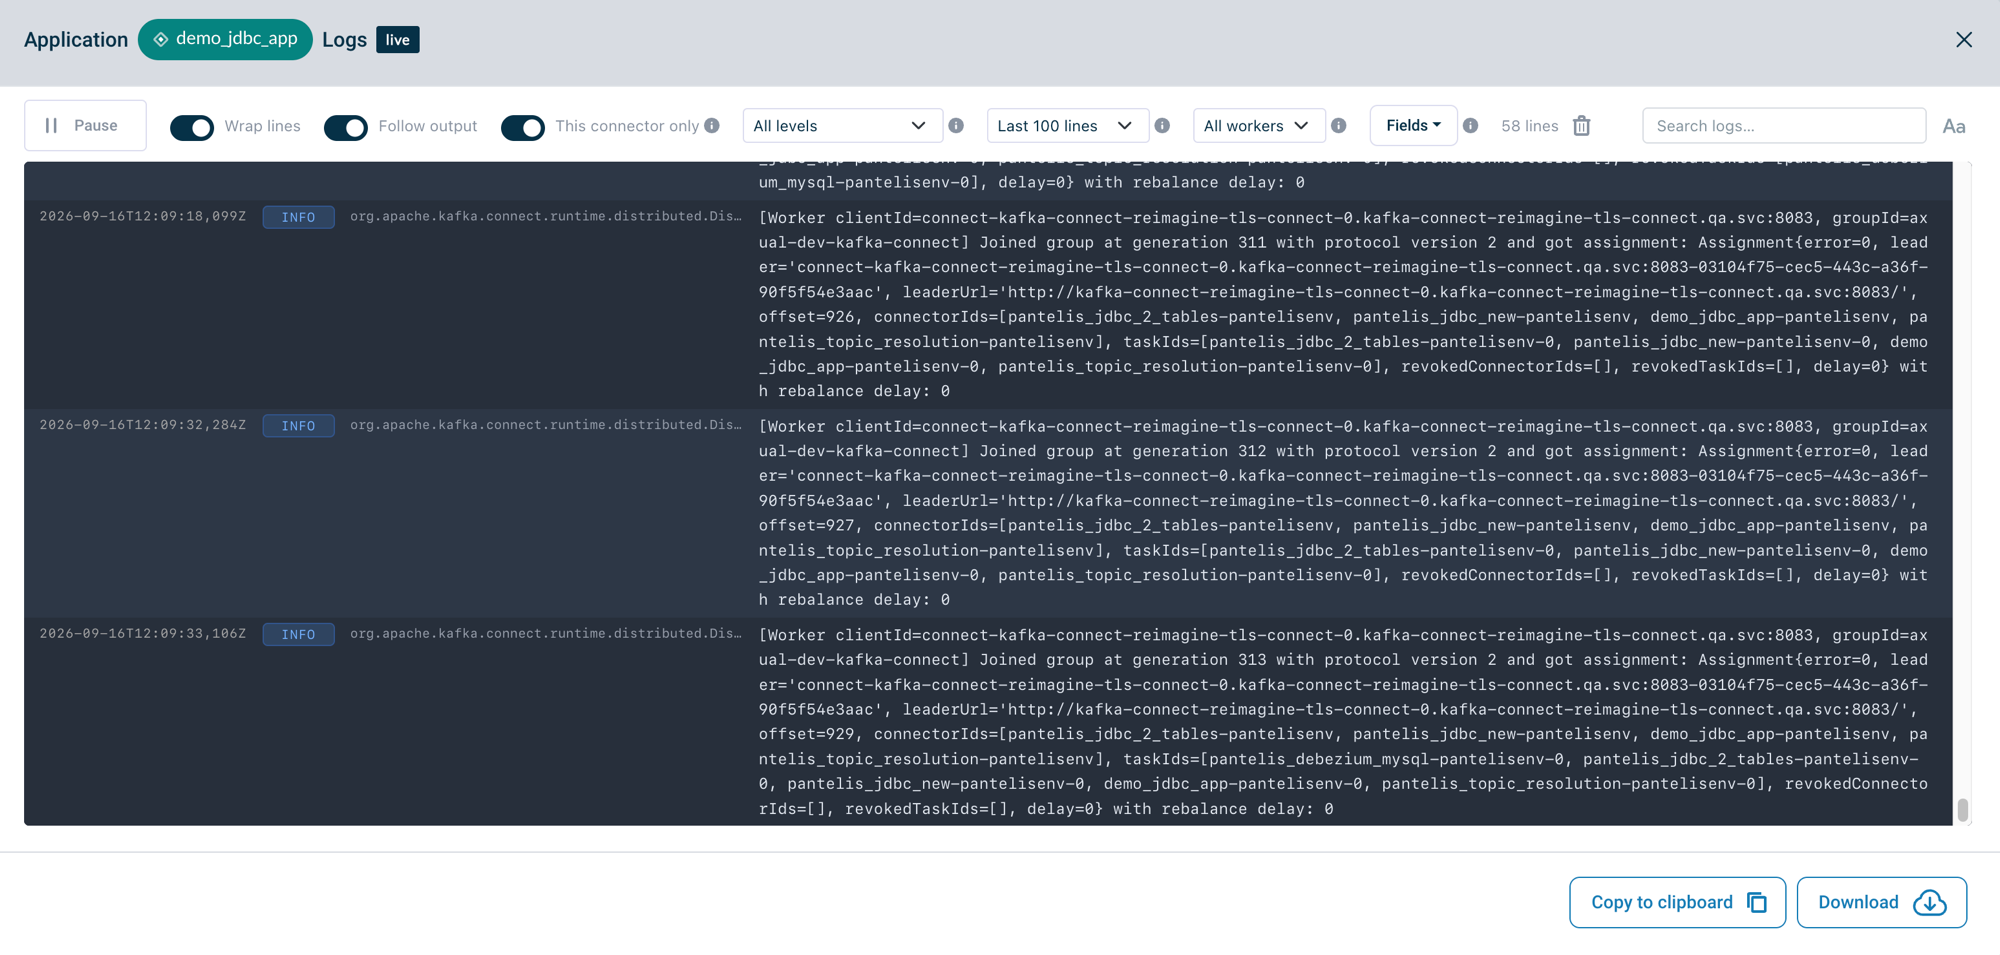
An empty console does not mean logs are unavailable. The message in it names the case:
-
There are no logs available for this Application.The console reached the application, and it has written nothing. -
No logs from this connector. Turn off This connector only to see everything its workers logged.The connector’s own lines are empty, so widen the scope to its workers. -
No logs for <level>. Choose All levels to see everything.Nothing survived the severity you picked. -
No logs from <worker> in this window. Choose All workers to see everything.The worker you picked wrote none of the lines the console holds.
A single line reading Application is starting… means the container is not up yet. The console reconnects every five seconds while that stays the newest line, so it fills in on its own once the container starts.
A connector that has never run has no logs to show at all, and its button on the application card is disabled with the reason Start the connector to see its logs. A connector that has never run has no logs yet.
|
Follow, pause and resume the stream
The console follows the log while it streams, so new lines push older ones up. Use these controls when you need to read something that keeps scrolling away:
-
Pause stops the stream and leaves the lines already received on screen. Resume reconnects and starts a fresh stream.
-
Follow output keeps the view pinned to the newest line. Turn it off to stay where you are while lines keep arriving, then use Jump to latest to return to the end.
-
Wrap lines folds long lines into the width of the console instead of scrolling sideways.
Two limits apply to the console:
-
The console holds the newest 10 000 lines. Older lines are dropped silently as new ones arrive, with no warning.
-
A stream stays open for 30 minutes. After that the header shows Stopped, and Resume starts a new stream.
| Search, Copy to clipboard and Download Visible Logs reach only what the console holds at that moment, so a line you were reading can be gone by the time you act on it, dropped to make room for newer output. Pause the stream to hold what is on screen, and use Download Full Logs when you need a line the console has already dropped. Lines written before you opened the console were never in it. |
Count and clear the lines on screen
The toolbar keeps a running count of the lines on screen, such as 1248 lines, and the bin icon beside it empties the console.
-
The count follows what you can see, so it drops when you narrow the console to one worker and rises again when you go back to All workers.
-
The bin icon, labelled Clear logs, removes every line on screen. The stream keeps running, so new lines keep arriving straight after. The icon is disabled while there is nothing to clear.
Clear the console before you restart a connector, so the lines arriving next are the restart and nothing else.
| The count is what the console holds now, not what the application has written. It never passes 10 000, and it resets to zero when you clear the console or change a setting that reopens the stream. |
Search the log output
Search runs over the lines the console currently holds, and highlights every match.
-
Type into the search box on the right of the toolbar.
-
Use the up and down arrows to step through matches. The counter beside them shows the current match and the total.
-
Click the match-case button to make the search case-sensitive, for example to separate
ERRORfromerror.
Switching between connector and cluster logs
A connector runs on a Kafka Connect cluster whose workers log every connector deployed to them. The This connector only toggle chooses which of the two you read. It appears for connector applications only, because a KSML application has a runtime of its own and no wider scope to switch to.
| This connector only | What the console shows |
|---|---|
On (default) |
The lines of this connector alone. |
Off |
Every line the target cluster’s workers write, which includes the other connectors deployed to that cluster. |
With This connector only off, lines from every worker of the cluster are merged into a single chronological order rather than shown one worker at a time, so interleaved output from two workers reads the same way it would from one machine.
Turn This connector only off when a connector never reached a running state. A connector that failed to start has written nothing under its own name, so its filtered log is empty. The reason it never started is in the worker log.
A running connector can also have lines missing from the filtered scope, for a different reason. See Why the connector filter can miss lines.
Switching the toggle reopens the stream and clears the console, because the two scopes are different content and interleaving them would attribute lines to the wrong connector.
| The cluster scope shows the log lines of every connector on that Kafka Connect cluster, including connectors owned by other groups in your tenant. It reads no cluster your application is not already deployed to. |
Why the connector filter can miss lines
This connector only is best effort. It shows the lines the platform can attribute to this connector, which is nearly all of them, and it cannot show a line that arrives with nothing naming the connector on it.
Almost every line a connector writes passes through the worker’s logging framework, which stamps each line with the connector that produced it. The filter matches on that stamp. A connector that writes straight to standard output instead, for example with a raw System.out.println call, goes around the logging framework, so its lines reach the console unstamped. The filter has nothing to match on and drops them, even though that connector wrote them.
This is why turning the toggle off can look inverted, as though the wider scope were the one showing this connector’s output. The lines were always this connector’s. They were never labelled as such, so only the unfiltered scope keeps them.
Few connectors write this way, and whether one does is a property of the connector’s own code rather than of the platform. Kafka’s FileStreamSinkConnector is the example most people meet.
Two scopes are complete, and neither depends on the stamp:
-
Turn This connector only off to read every line the cluster’s workers wrote.
-
Use Download Full Logs to take the whole log file each worker is writing now, as described in Copy or download the logs.
Use one of those before concluding that a connector logged nothing.
Filter the output by log level
The Log level dropdown drops every line below the severity you pick. It appears for connector applications only, alongside the This connector only toggle.
| Log level | What the console shows |
|---|---|
All levels (default) |
Every line the workers write, whatever its severity. |
Info and above |
|
Warnings and above |
|
Errors and above |
|
A line that carries no severity of its own, such as a frame of a stack trace, stays with the line above it. An error therefore arrives with its whole trace under it, not as a bare first line.
Changing the level reopens the stream and clears the console, the same as the This connector only toggle. One console cannot hold two thresholds at once.
An empty console at Warnings and above or Errors and above usually means the workers logged nothing at that severity. The console says so directly, for example No logs for Warnings and above. Choose All levels to see everything. Pick All levels to confirm the application is logging at all.
Choose how much history to load
The History dropdown sets how many earlier lines the stream sends before it starts following the log. It appears for connector applications only, and starts at Last 100 lines.
-
Live only asks for no history, so the console holds only what the workers write from the moment the stream opens.
-
Last 100 lines, Last 500 lines and Last 1000 lines each load that many earlier lines first, then follow. 1000 lines is the maximum.
Changing the history reopens the stream and clears the console. Reopening is the only way to ask for more history, because the lines already on screen cannot be extended backwards.
| History reaches only as far back as the log the node still holds for each worker that is running now. The output of a worker that has already stopped cannot be read from Self-Service at all, whichever history size you pick. |
Read the lines of one worker
The Worker dropdown narrows the console to the lines a single worker pod wrote. It appears for connector applications only, because only a Kafka Connect cluster runs several workers.
-
Open the Worker dropdown. It offers every worker the console has seen so far, and reads No workers yet until a line names one.
-
Select a worker. The console keeps that worker’s lines and hides the rest.
-
Select All workers to go back to the full set.
Filtering by worker acts on the lines the console already holds, so it neither reopens the stream nor discards anything. Switching back brings the hidden lines straight back.
| A worker is not the same thing as a connector. The tasks of one connector can run on any worker of the cluster, and they move to another worker when the connector restarts, so one worker holds only the part of the log it wrote itself. |
Changing the Log level or the History reopens the stream, which empties the console and rebuilds the worker list from the lines that arrive next. The worker you selected stays selected while that happens, so a worker that has not logged again yet shows an empty console with a message naming it.
Choose which fields each line shows
The Fields dropdown lists the parts of a structured log line as checkboxes. The console shows each one you tick on every line that carries it.
| Field | Default | What it shows |
|---|---|---|
Time |
On |
The timestamp the worker wrote on the line. |
Level |
On |
The severity of the line, such as |
Worker |
Off |
The worker pod that wrote the line. Offered for connector applications only, and most useful once All workers holds more than one. |
Thread |
Off |
The thread that wrote the line. It is the widest field of the five, which is why it starts off. |
Logger |
On |
The logger that emitted the line, usually a Java class name. |
The fields render in the order above, whichever ones you tick. A line the console cannot parse into fields, such as the shell output a worker writes before its logging starts, shows its message alone.
Your choice is saved in the browser, so it applies to every log window you open next, for every application. Copy to clipboard and Download Visible Logs follow it too, which is worth checking before you attach a log to a ticket.
Copy or download the logs
Take the log with you when you want to attach it to a ticket or read it in another tool. On a connector application the Download button opens a menu offering two scopes. A KSML application has a plain Download button instead, which saves what the console holds.
-
Copy to clipboard copies the lines on screen, as the filters and the Fields choice leave them.
-
Download Visible Logs saves those same lines as a
.logfile. It is disabled while the console is empty. -
Download Full Logs asks the server for the log file each worker of the cluster is writing now, whatever the filters and fields are set to. It is a separate call, so it is bound by neither the console’s contents nor the 10 000 line limit. The button reads Downloading… until the file arrives.
Copying and Download Visible Logs act on the console’s current contents, so pause the stream first if you want a stable snapshot.
| Download Full Logs is the wider of the two scopes, and still not a complete history. A worker’s log file is replaced once it fills up, and only the file being written now can be read. |