Tenant Admin Insights
Insights
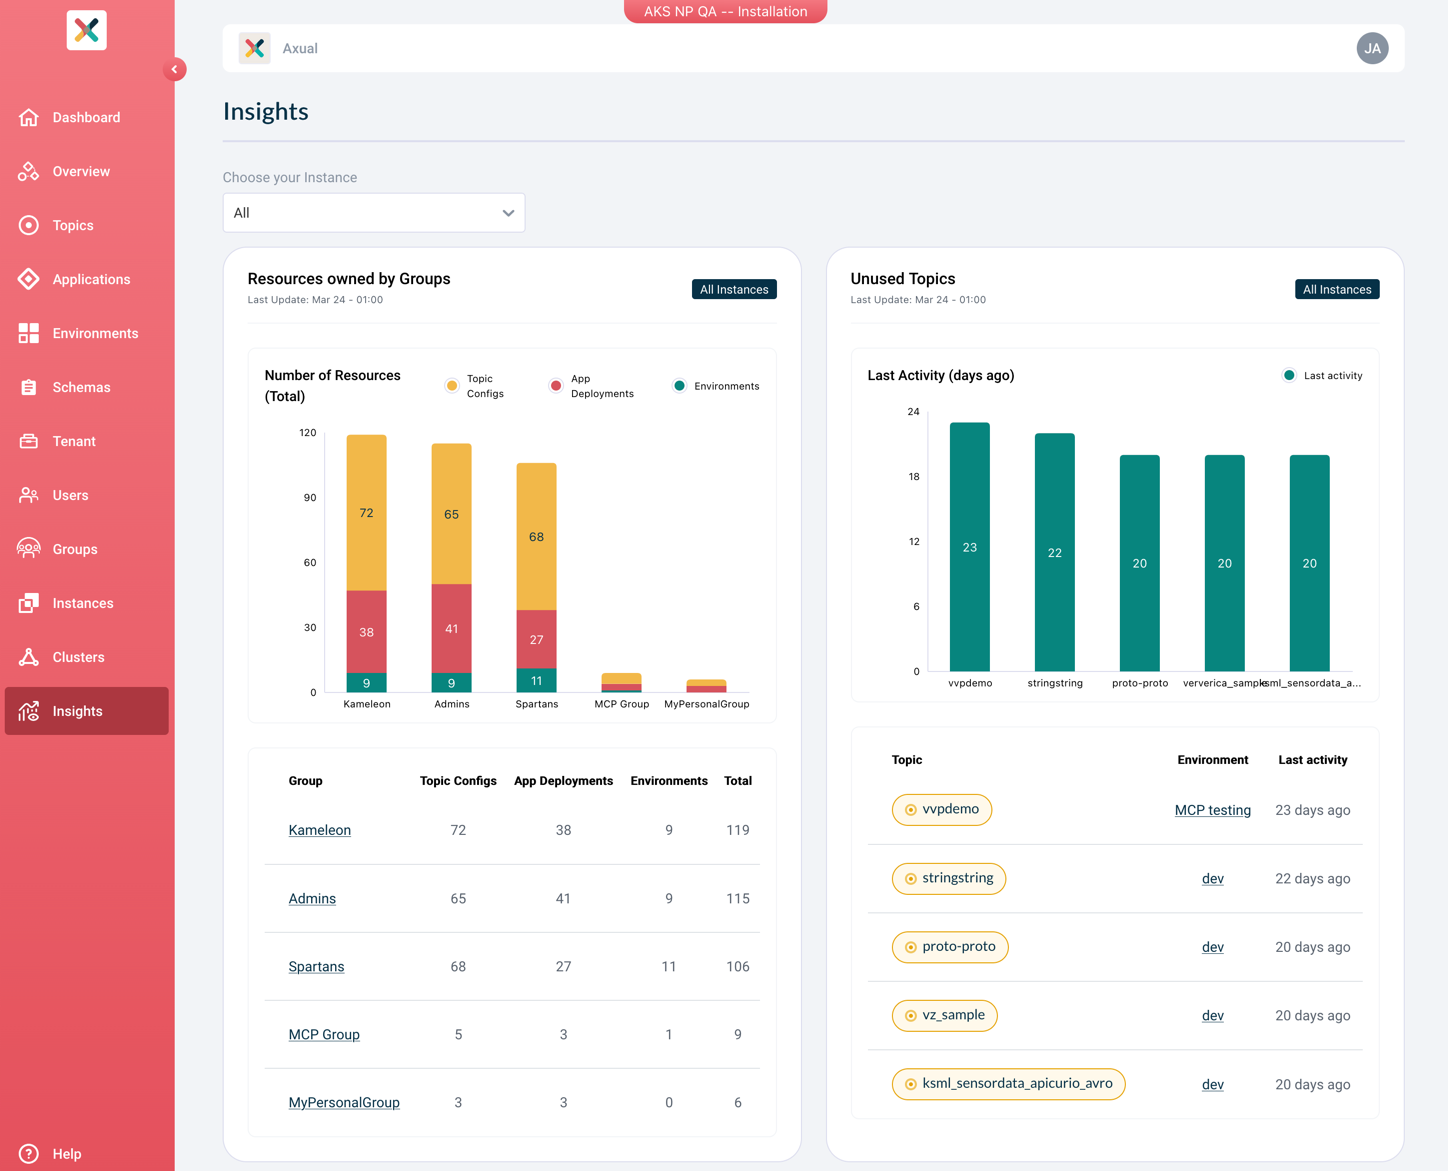
The Tenant Admin Insights feature provides Tenant Admins with an overview of how resources are distributed and used across Instances belonging to their Tenant. It displays key metrics through a set of charts, helping Tenant Admins identify trends, spot unused resources, and understand traffic patterns at a glance.
| Access to Tenant Admin Insights is restricted to Tenant Admins. |
Available Charts
The Insights overview currently displays the following three charts, each showing the Top 5 results for the selected scope.
| Chart | Description |
|---|---|
Resources by Group |
Shows how many Topic Configs, Application Deployments, and Environments belong to each Group. |
Unused Topics |
Shows Topics that have not been produced to, ranked by the number of days since the last message was produced. |
Topics with High Volume in 24 Hours |
Shows the Topics with the highest number of messages produced in the last 24 hours. |
Data Collection
The data shown in the Insights charts is collected by two background jobs running in Platform Manager on a configurable schedule:
-
Resource ownership — counts Topic Configs, Application Deployments, and Environments per Group.
-
Topic volume — tracks message counts and identifies Topics that have not been produced to.
Both jobs default to running daily at midnight. The recency of the data displayed in the charts therefore depends on when these jobs last ran. See Platform Manager — Insights Configuration for details on how to configure the collection schedule.