Metrics Exposer
Functionality
Overview
The Metrics exposer is an Axual Service which is used to generate metrics for use in prometheus, or via API calls. The metrics exposer generates information on message rates, message sizes, stream size and more.
Example use
A customer of the Axual SaaS offering does not have direct access to metrics of the cloud service. Suppose they are interested in monitoring activity on topics, they can set up the Axual Metrics Exposer to view dashboards and setup alerting in their own infrastructure.
Detailed usage
Usage details can be found in section Client Metrics.
Installation
The Metrics Exposer is dependent on an installation of Prometheus and Axual Self-Service.
Helm Charts
As part of the Governance Helm charts, the Metrics Exposer can be installed following the guide Axual Streaming & Governance Installation.
Configuration
|
If you are looking for the API documentation, it can be found here |
In order to use some metrics offered by Metrics Exposer, named io.axual.application/consumer_lag_records and io.axual.application/consumer_time_to_catch_up,
kafka_exposer must be enabled.
By default, it is disabled when deploying the cluster, and it can be turned on by setting the core.kafka.kafka.kafkaExporter.enabled property to true.
The super users list also need to be updated so kafka_exporter can access the resources in the Kafka cluster regardless of any access restrictions, and is supported by all authorization mechanisms.
To do that, add the user to the core.kafka.kafka.superUsers property. If the user uses TLS client authentication, their username is the common name from their certificate subject prefixed with CN=.
| Please note that you MUST keep the current super users you have configured! |
An example would look like the below example:
axual-streaming:
  kafka:
    kafka:
      kafkaExporter:
        enabled: true
      superUsers:
        # keep the current super users you have configured!
        - [existing entries]
        - "[0] Intermediate Certificate used by Cluster, [1] CN=[CLUSTER_NAME]-kafka-exporter,O=io.strimzi"
After updating the configuration, upgrade the Axual Platform release using the above modified values.yaml:
helm upgrade --install platform axual-stable/platform -f values.yaml --version=<helm-chart-version> -n kafkaThat will start a new Pod that exports the Kafka consumer lag (kafka_consumergroup_lag) amongst other metrics for your kafka brokers.
Grafana Integration
Metrics Exposer can be used as a datasource for dashboards and can be integrated with any visualisation tool. Next section would provide an example on how to integrate Metrics Exposer with Grafana.
Installing a plugin
Go to Configuration > Data sources > Plugins and install plugin called Infinity. This plugin provides a way to create a datasource using HTTP POST method, which is used by Metrics Exposer.

After installation click on "Create a Infinity data source" and proceed to the datasource.
Datasource Configuration
Let’s configure our datasource:
in "Authentication" tab:
-
Auth type - choose Bearer token
-
Bearer token - retrieve an access_token from Keycloak for a client with scope "metrics-exposer" and insert it here
-
Allowed hosts - provide a host url, where Metrics Exposer is available
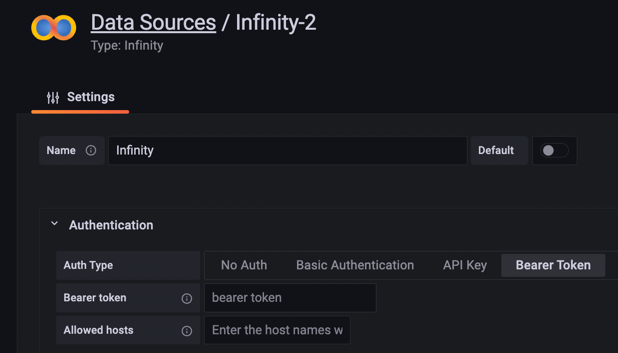
Press "Save & test". Now, you are ready to create a personalized dashboard and a panel.
Creating a Dashboard
One Dashboard can have as many Panels as you like, they can be used for alerting or for visualization. Let’s create a panel, so we would see some data of our stream.
Go to Dashboards > + New Dashboard > Add New Panel
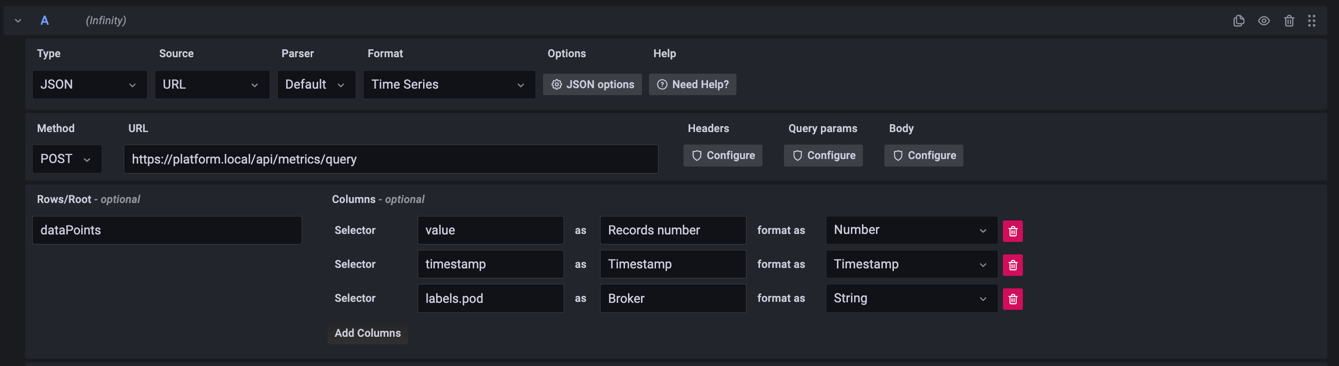
You will see a query configuration as below:
-
Set format to Time Series
-
Set method to POST
-
Update URL to your host installation
-
Configure Body with the metric request you want to be in the dashboard, e.g.:
{
	"metric": "io.axual.stream/size_records",
	"groupBy": [],
	"stepSize": "PT1M",
	"timeWindow": "PT1H",
	"filter": {
		"type": "AND",
		"filters": [{
				"type": "FIELD",
				"field": "environment",
				"operation": "EQUALS",
				"value": "dev"
			},
			{
				"type": "FIELD",
				"field": "stream",
				"operation": "EQUALS",
				"value": "payment-events"
			}
		]
	}

}| Don’t forget to change Body Content Type to the JSON format |
-
Based on your chosen metric and the response data structure can vary, so set columns and rows (
dataPointsorgroups) to be parsed accordingly.
After that, you should be able to see data points in your Grafana Panel.
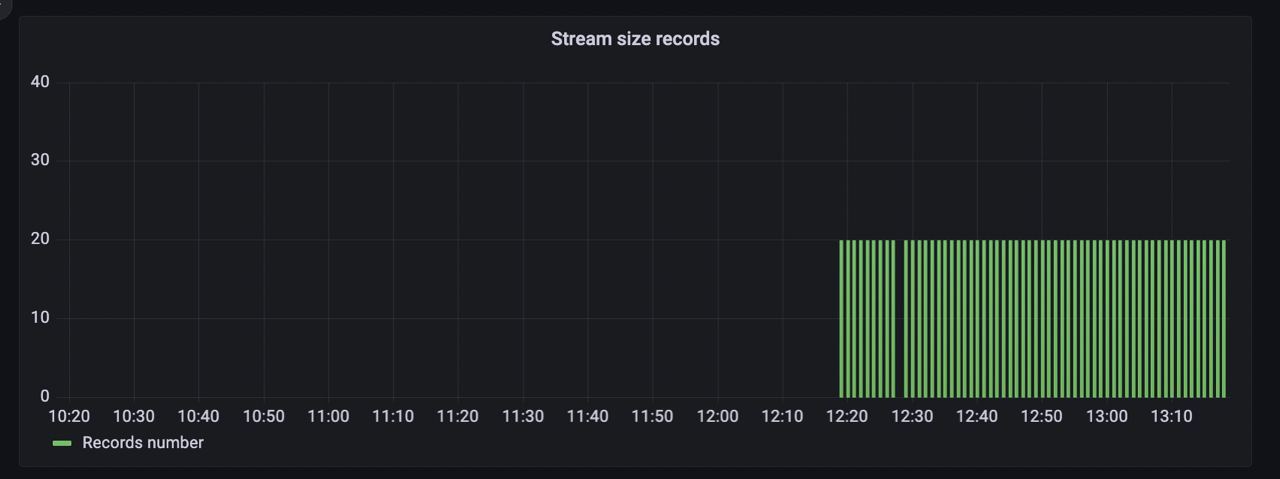
Further panels configuration guides can be found here