Logging
Log basics
Reading application logs is the first step to troubleshoot an application. Most Axual Platform components are Java based and use the Logback logging library.
First get a list of the Pods in the namespace.
kubectl get pods -n kafka

NAME                                                              READY   STATUS       RESTARTS          AGE
axual-governance-api-gateway-6dff79c9d9-rrckq                     1/1     Running      1 (2d22h ago)     4d3h
axual-governance-keycloak-0                                       1/1     Running      2 (7h3m ago)      6d1h
axual-governance-platform-manager-694475c59c-kn9x4                1/1     Running      4 (7h3m ago)      6d1h
Then show the logs of a particular Pod
kubectl logs -n kafka axual-governance-platform-manager-694475c59c-kn9x4Changing log configurations
Each Axual microservice can be configured with a log level and log pattern. The log levels for each service except for the broker can be configured on the fly - no restart required - by changing the values.yaml file and redeploying the chart (see: Ways of deploying Axual (Best practices)).
| It is advised to not change the log pattern to avoid breaking downstream log centralization tools and possible alerting rules. |
In a troubleshooting scenario you can modify log configurations directly on the Kubernetes resources and save some time circumventing the GitOps workflow. This ad-hoc change will be repaired with the next GitOps synchronization.
Example log configuration
<component> #1
  config: #2
    logging: #3
      audit:
        pattern: "%date{\"yyyy-MM-dd'T'HH:mm:ss,SSSXXX\", UTC} [audit] [%t] %-5level %logger{36} - %msg%n"
        rootLoglevel: info #4
      loggers:
        pattern: "%date{\"yyyy-MM-dd'T'HH:mm:ss,SSSXXX\", UTC} [system] [%t] %-5level %logger{36} - %msg%n"
        rootLoglevel: info #4
        io.axual: info #5
        io.axual.auditing.logging: info
        org.apache.catalina.core.StandaloneService: DEBUG #6
In the above example, note the following numbers:
-
Locate the right component in the values.yaml, for example
platform-managerorapi-gateway -
Locate the
configsection, this will allow you to make changes in theapplication.ymlfile that is used to configure Spring Boot applications. You can verify/modify the log configuration in the Kubernetes ConfigMap that is named similarly to the component. -
The
loggingsection is where you can change log levels and optionally log patterns. -
Changing the
rootLoglevelwill change all log configurations to that level, except the ones that are overridden at package level. So if you changerootLogleveltoDEBUG, expect to get spammed. -
Instead of changing
rootLoglevel, it’s usually best to change log levels of specific Java packages -
There is granular control of log levels, allowing you to change log levels of specific Java classes.
Rest Proxy and Axual Connect Helm charts have logging one level above the config key but work in a similar fashion. Kafka log configuration has its own section. Other exceptions are Keycloak, Vault and Apicurio.
|
Audit logging
Audit logging is used to create an audit trail on user actions to show who exactly did what on secure resources.
Within Axual Platform the platform manager writes audit logs with the io.axual.auditing.logging package, these can be filtered out for long-term storage if required.
Centralized logging
When running multiple services and applications on a Kubernetes cluster, a centralized, cluster-level logging stack can help you quickly sort through and analyze the heavy volume of log data produced by your Pods.
Centralized logging is not part of the Axual Kafka platform but should be made available in the infrastructure where the platform runs. By simply gathering the Pod logging (for example using Fluentd), all relevant applications logs can be searched.
Structured logging
Human-readable logs are difficult to parse and index for most centralized logging systems. Writing logs in a structured format, like JSON, greatly improves the opportunities to route logs into centralized storage and for the centralized logging solution to index these logs. The Axual Platform currently does not yet fully support JSON logs.
ElasticSearch
One popular centralized logging solution is the Elasticsearch, Fluentd, and Kibana (EFK) stack. Other popular solutions are Loki and Splunk.
Elasticsearch is a real-time, distributed, and scalable search engine which allows for full-text and structured search, as well as analytics. It is commonly used to index and search through large volumes of log data, but can also be used to search many different kinds of documents.
Elasticsearch is commonly deployed alongside Kibana, a powerful data visualization frontend and dashboard for Elasticsearch. Kibana allows you to explore your Elasticsearch log data through a web interface, and build dashboards and queries to quickly answer questions and gain insight into your Kubernetes applications.
Example: Viewing Logs with Elastic and Kibana
This section describes how logs can be searched for troubleshooting issues. We also show where alerts can be created for alerting possible problems appearing in log streams.
The Axual cloud uses the EFK (ElasticSearch, Fluentd & Kibana) stack as Centralized Logging solution. Kibana can be used to search logs and alerts can be created from incoming log streams.
Viewing Logs
A screen will open where all logs can be viewed. Inside this screen, you will need to select the Elastic Search Index for the logs that you want to view. The index can be selected from the drop-down at the left of the screen:
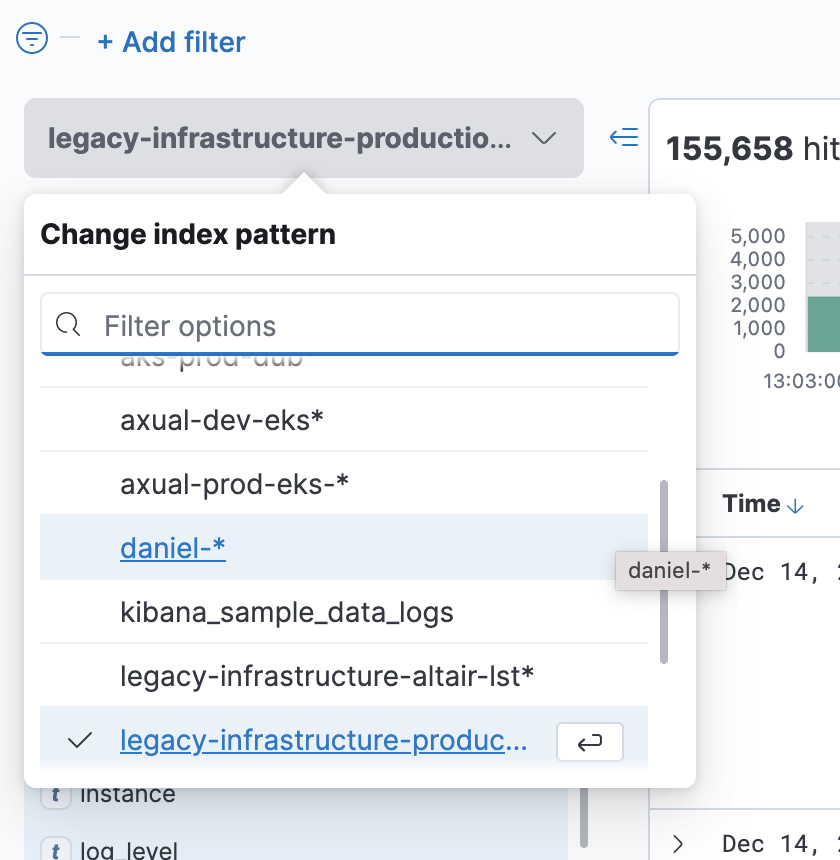
Please contact your administration team details on the logs index names available.
Once you have found the correct index, create filters to search for log messages.
-
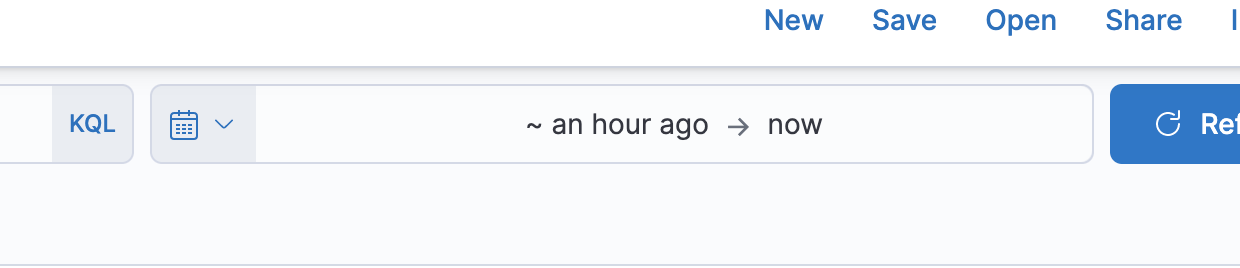
At the top of the window, click inside the time filter to show messages for a certain time range. Generally, you will look at the last half hour to an hour of activity. But if a user reports an issue at a certain time, then you would search at five minutes around that time.
-
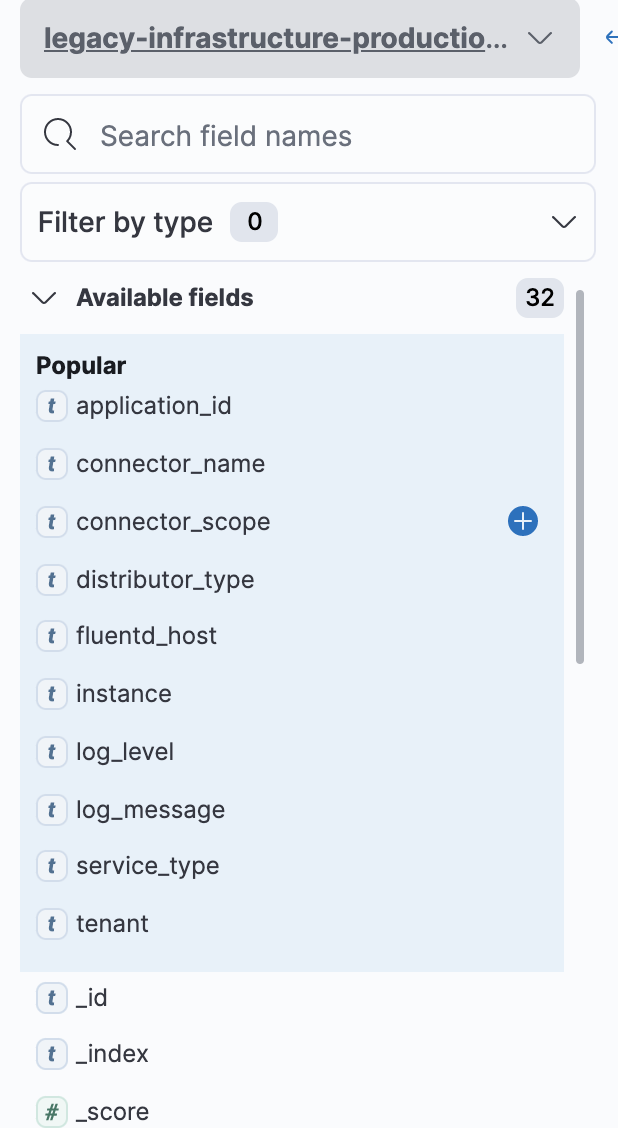
On the right side of the screen, click a field to add a filter on that field. A popup will list unique values for the field in the last 500 messages. Choose one of the values to filter all messages on that value.
-
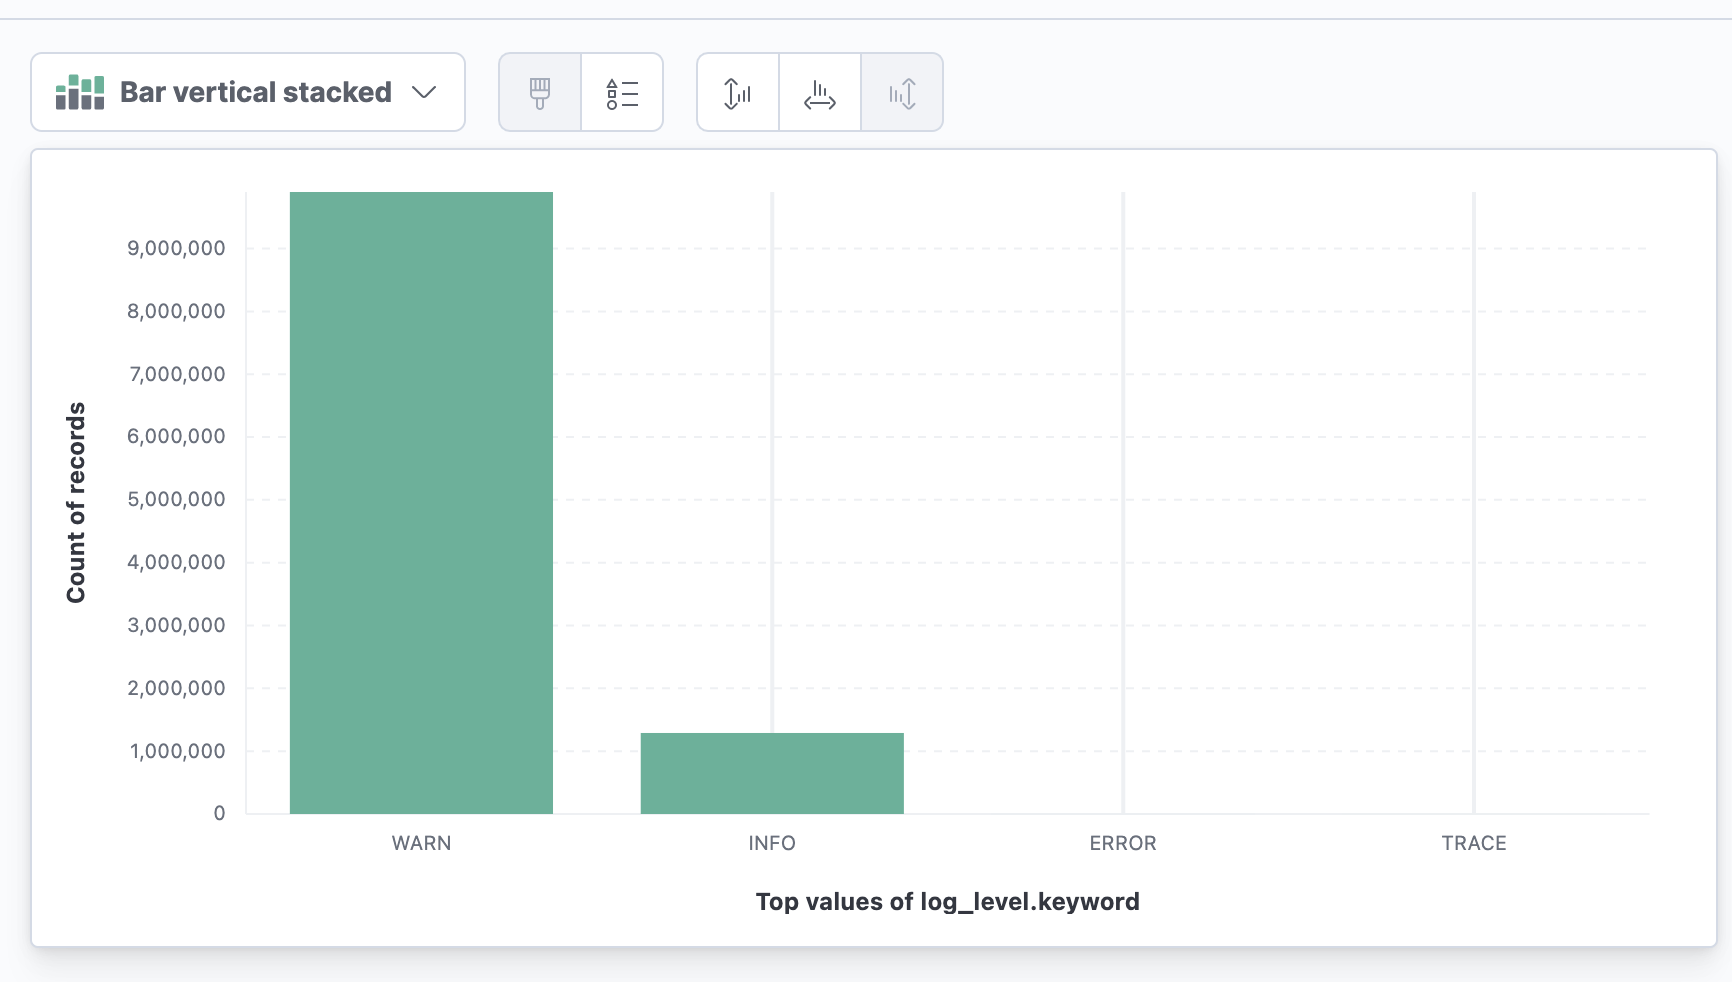
Sometimes, you want to filter on a value that does not appear in the past 500 messages, to view all values for that field inside a time range, click the field and then Visualize. In the next screen all distinct values for that field are listed.
-
To create an ad-hoc filter, click the search input and type the filter (Use a colon
:for equals)
Commonly used filters are:
-
log_level: DEBUG, ERROR, INFO, TRACE, WARN -
service_type: the name of the Axual service. (broker, connect,..) -
container-name: The name of the Kubernetes container. -
tenant: The tenant causing the error. -
remote_host: The host from which the connection is made.
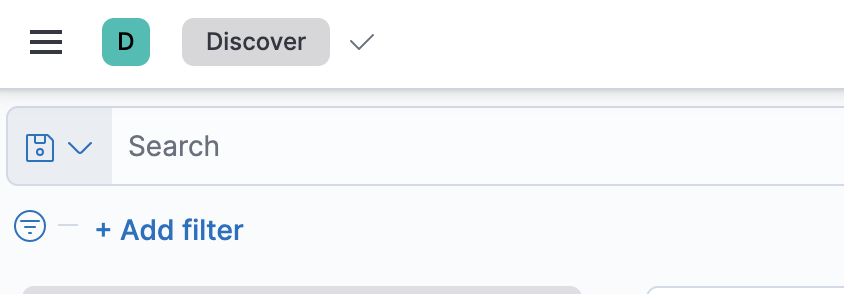
To enhance your searches inside the Discover tab, the Kibana query language is a powerful way to get the information you need. Check out the documentation and remember to use AND and OR capitalized.
Alerting
It is possible to be alerted if logging occurs matching a filter. (For example, if log_level : ERROR and log_message : ‘This is very bad.’)
-
Click the gear icon from the left toolbar: Management.
-
From the Elasticsearch list, click on Watcher.
-
From Watcher page:
-
Click the Create button
-
Choose Create threshold alert
-
From Create threshold alert page: Enter the Name of the alert.
-
Select the index in the Indices to query field.
-
Select timestamp in the Time field area.
-
Define the time threshold in the, 'Run watch every fields'
-
Use the embedded query generator to generate a Matching Condition
-
-
Send the alert: Open Kibana and then:
-
Click the Add Actions button
-
Choose Slack or Email.
-
Addendum: Obtaining log files on a local installation
Sometimes it is necessary to search log files on a local installation, a local centralized logging solution may not be available for example.
Generally, Kubernetes logs system logs to the /var/log/ directory. Each pod logs to the directory pods/<namespace>_<pod_name>_<pod_id>/<container_name>/ and most Axual pods contain multiple containers. If you are testing on a local OS such as Mac, Kubernetes runs on a Virtual Machine. To view the entire log file you will need to first enter the environment of the Virtual Machine. On a Mac you will need to either:
-
View the logs by attaching to a second docker container sharing the same logs directory.
docker run -it --privileged --pid=host debian nsenter -t 1 -m -u -n -i sh-
Screen to the Virtual Machine (This may not work. Different Mac versions work in slightly different ways.)
screen ~/Library/Containers/com.docker.docker/Data/vms/0/tty