Monitoring & Metrics
Metrics
Metrics are numerical data that applications emit when active. These can show application details such as:
Insight in these details is essential to keep applications performing well and forms the basis for graphs, dashboards and alerting callouts.
Spring Boot Actuator
For most Axual components, these metrics are exposed using Spring Boot Actuator, of which only a few endpoints are enabled for security considerations.
Apart from providing metrics, Actuator is often used internally for Kubernetes Liveness and Readiness Probes, for example on the /actuator/health/liveness endpoint.
Kafka Exporter
Kafka metrics are made available through the Strimzi Kafka Exporter that is enabled by default on Kafka installations via Axual.
Details
For more details on individual Axual component metrics, refer to the Components section of the documentation or explore available metrics in Prometheus, Grafana or on the /actuator/prometheus endpoint after port-forwarding the Service.
Monitoring
On top of Kubernetes there are several mechanisms that provide the interface between Pods and monitoring tools. Axual Platform components come with PodMonitors, ServiceMonitors and PrometheusRules out of the box.
Prometheus
Prometheus is a very common monitoring tool in the Kubernetes ecosystem that is used and recommended by Axual. Other monitoring, visualisation and alerting tools would work similarly but are not considered in Axual documentation.
| Prometheus and related components like Grafana and AlertManager are not delivered as part of the Axual Platform and is expected to be provided by an infrastructure team. |
Usually there will be a central Prometheus that federates data of multiple Kubernetes clusters for a single datasource of dashboards and alerting.
Labels
Prometheus often requires specific labels to be present on Kubernetes resources (Service/Pod Monitors, PrometheusRules etc), these can be set in the values.yaml of the Axual Helm Charts, for example:
prometheusRule:
    # -- Enables creation of Prometheus Operator [PrometheusRule](https://prometheus-operator.dev/docs/operator/api/#monitoring.coreos.com/v1.PrometheusRule).
    # Ignored if API `monitoring.coreos.com/v1` is not available.
    enabled: false
    # -- Determines how often rules in the group are evaluated.
    interval: ""
    # -- Additional labels for the PrometheusRule
    labels: {}
Verify Prometheus scraping:
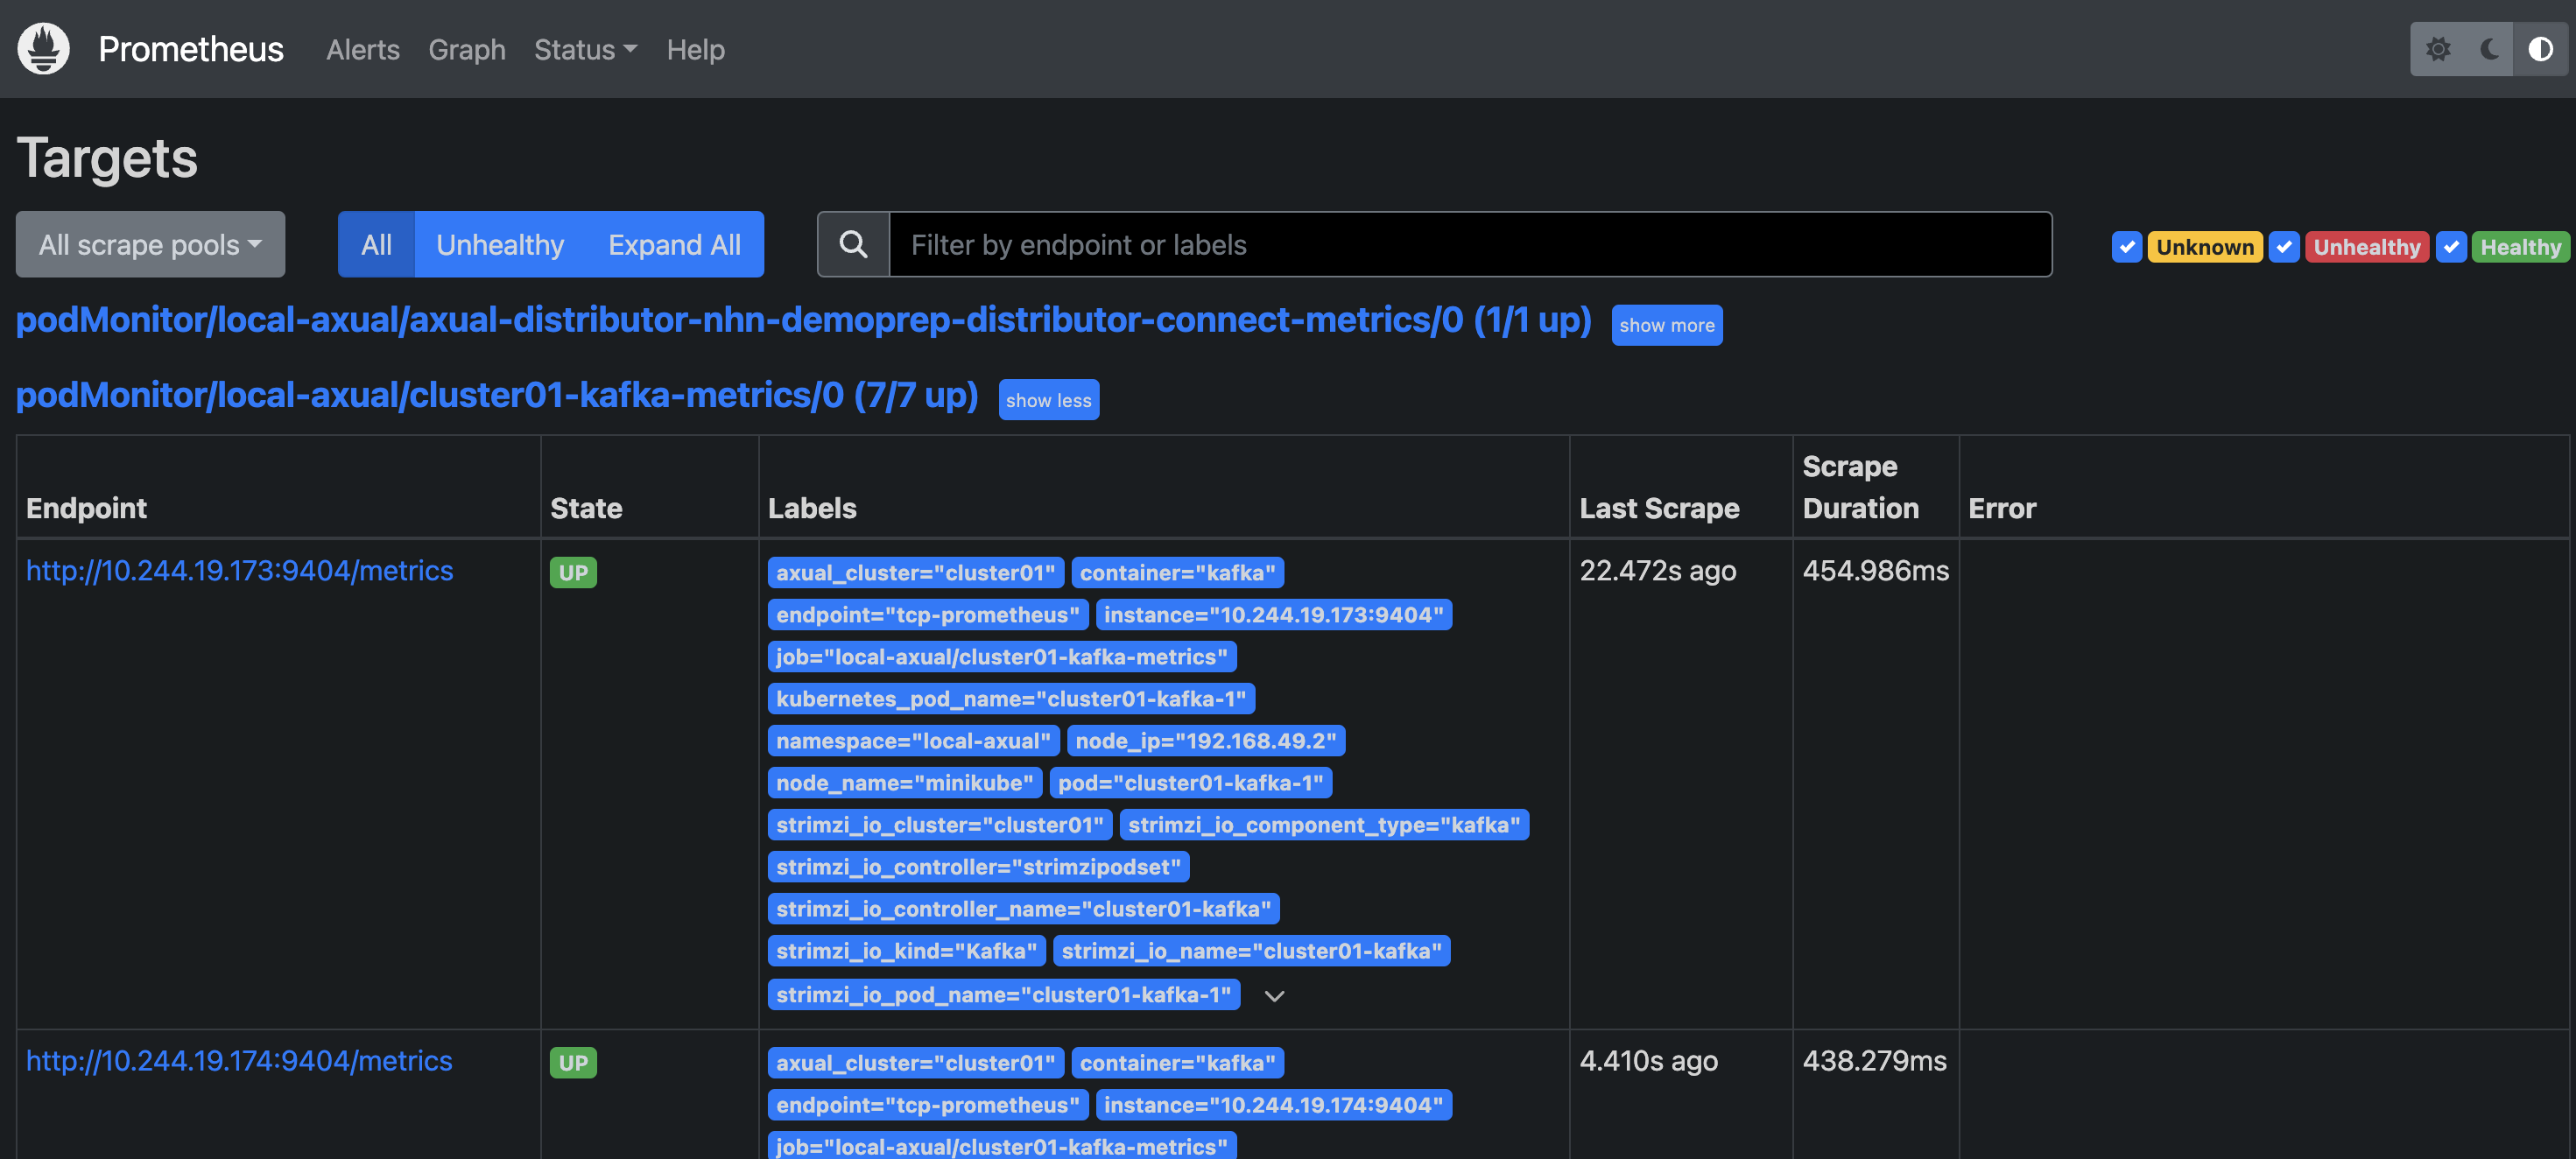
Prometheus leverages a so-called "pull mechanism" to scrape endpoints, meaning that defined "targets" will be "scraped" on a set interval, usually at 20-30 seconds, so refreshing faster does not provide any benefits. To verify successful scraping, you can do the following:
-
Access Prometheus through a port-forward or a URL if available, this should give you an UI like the image below.
-
Check Prometheus targets on the
/targetsendpoint, verify if the required target is present. -
Writing Prometheus queries can be done on the Prometheus
/graphendpoint
Grafana
Grafana’s role is to visualize Prometheus metrics in dashboards of many shapes and sizes.
Dashboards
The dashboards below are advised to be installed in your central Grafana to monitor the Axual Kafka platform. Installation can be done by importing the JSON file into Grafana or by creating a ConfigMap to adhere to GitOps practices.
Dashboard Name |
Contents |
A high-level dashboard showing the cluster status and metrics, e.g. cluster health, data and request rates |
|
Dashboard which exposes metrics that concern to Rest-Proxy, e.g. schema status, message produce and consume status and common JVM metrics |
|
Dashboard which exposes metrics that concern to Kafka clusters, brokers and associated components |
|
Dashboard showing metrics pertaining to specific consumer group and topic of a Kafka cluster including offset, lag, partition metrics |
|
Dashboard showing metrics related to ZooKeeper clusters, offering insights into the health, performance, and operational aspects of ZooKeeper nodes within a cluster |
|
Dashboard showing metrics associated with the Strimzi Kafka Operator, including resource usage, reconciliation statuses, and other relevant operational metrics |
|
Dashboard representing critical metrics related to Kafka Connect connectors, throughput and worker performance |
Using these dashboards you can verify and establish a baseline for the following questions:
-
What is the normal system load?
-
Can the brokers handle the load?
-
Is there a level of CPU, Network Usage or Disk Usage that correlate to bad performance?
-
Are there any (Cron) jobs running on the system that may slow the system at certain times.
-
Is there a need to add more Connect Nodes or Rest Proxy instances to handle extra load?
-
Are the servers loaded evenly? Should you think about using a system such as Cruise Control to balance load?
-
What is a peak load that can be efficiently handled by the system.
| Do not only use Grafana to visually search for issues, but in times of good system performance, periodically create baseline statistics for your system. If there are ever performance issues you will not have a good idea of how to improve the system if you have not spent time in creating baseline statistics. |
Alerts
For alerting based on metrics, Axual would suggest using AlertManager due to its good integration with Prometheus. In many production deployments there will already be an alerting system in place somewhere within the infrastructure, allowing the on-call night shift to react to outages.
Alternatively, alerting based on log data could also be considered.
PrometheusRules
Alerts are triggered via PrometheusRules, of which some are part of the Axual Helm charts, but others should be installed in the central location that on-call operators often view.
For example these Kafka PrometheusRules provided as example by Strimzi would be a good starting point to tailor alerts according to your organization’s needs.
| Collaborate with the team responsible for night shift standby to set up good alerting rules that fit your organisation. Having any omissions in alerting call-outs may result in Kafka disasters, such as filled up disks or cluster unavailability. |