Topic metrics
Topic Size Metrics
These metrics are calculated across several brokers and partitions.
The following steps are followed to calculate the metrics:
-
Values get queried across all the replicas (represents values of all partitions with replicas)
-
Values get aggregated using
sumaggregation function by pod (represents value for requested topic per pod)
For these metrics, all aggregation functions and groupBy are supported.
Topic Rate Metrics
These metrics are calculated by performing a Prometheus’s rate function.
The rateSize by default is 5 minutes, but it can be set to anything you prefer.
Rate function takes several data points back in time and calculates mean value.
Using rateSize
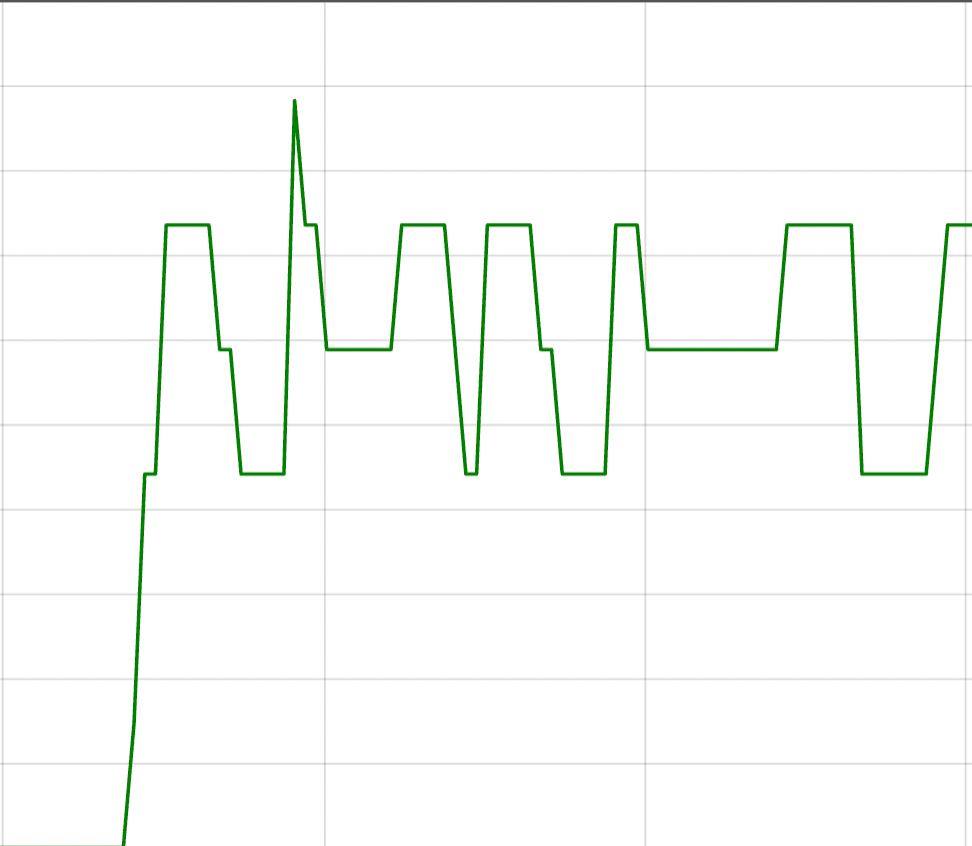
Decreasing the rateSize will make the result more "sharp", since window would contain fewer data points and spikes will be visualized better.
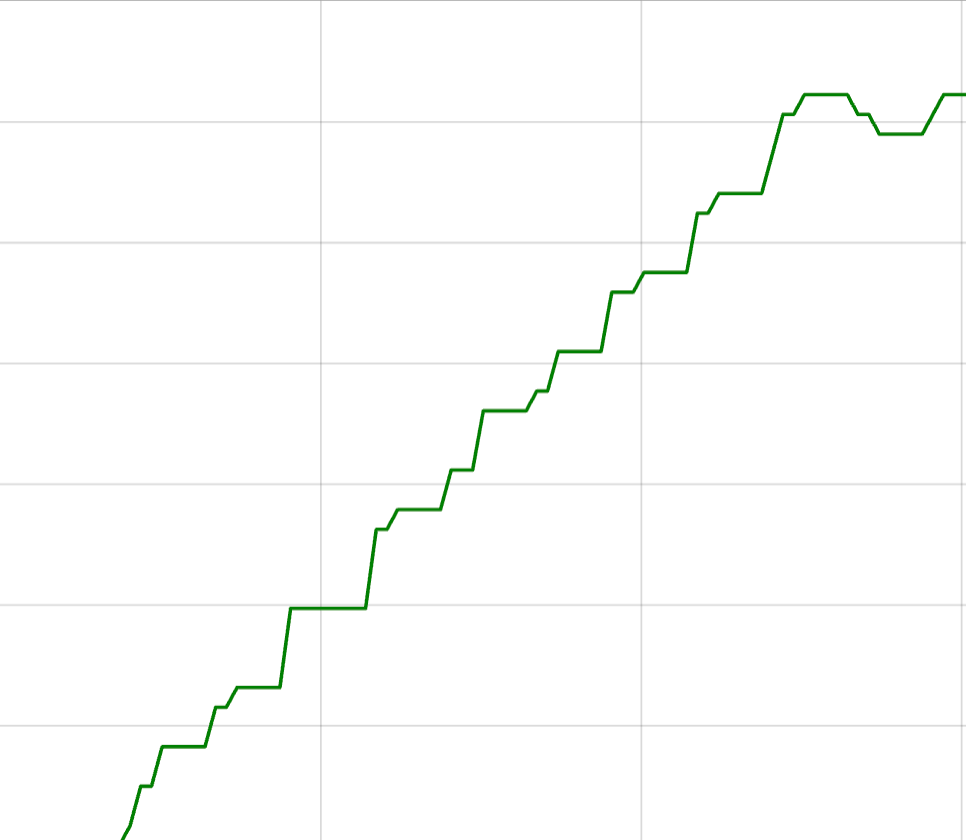
Increasing the rateSize will make the result more "smooth", since window would contain more data points and producing/consuming spikes will be smoothed.
| We suggest to take a look at this article that tries to explain how the rate function works in Prometheus. |
As mentioned in the Topic Rate description section, rateSize can be changed for different result.
Below is the examples of using different rate size.
Request with rateSize of 5 minutes
Unresolved include directive in modules/ROOT/pages/self-service/client-metrics/topic/topic-metrics.adoc - include::example$/client-metrics/topic/incoming-byte-rate/request-rate-size-5-minutes.json[]
Response with rateSize of 5 minutes
Unresolved include directive in modules/ROOT/pages/self-service/client-metrics/topic/topic-metrics.adoc - include::example$/client-metrics/topic/incoming-byte-rate/response-rate-size-5-minutes.json[]
Request with rateSize of 1 minute
Unresolved include directive in modules/ROOT/pages/self-service/client-metrics/topic/topic-metrics.adoc - include::example$/client-metrics/topic/incoming-byte-rate/request-rate-size-1-minute.json[]
Response with rateSize of 1 minute
Unresolved include directive in modules/ROOT/pages/self-service/client-metrics/topic/topic-metrics.adoc - include::example$/client-metrics/topic/incoming-byte-rate/response-rate-size-1-minute.json[]
Visual comparison
With rateSize of 5 minutes:
With rateSize of 1 minute: