Monitoring
Overview
We use Grafana for visualizing metrics as dashboards.
We monitor two types of Connect components:
- The Connect-Cluster itself: the docker containers on which connectors run
- The connectors started by platform users.
There is an abundance of metrics offered by Connect which can be used to generate dashboards catered to specific needs. Here we present the dashboards that come out of the box as a generic solution to monitoring connect. More dashboards can be added depending on the setup at hand.
Grafana extracts all the metric-values from Prometheus, then it builds the graphs we use to visualize them.
Monitoring Connect
The Connect Dashboard provides a general overview of Connect service of a given instance.
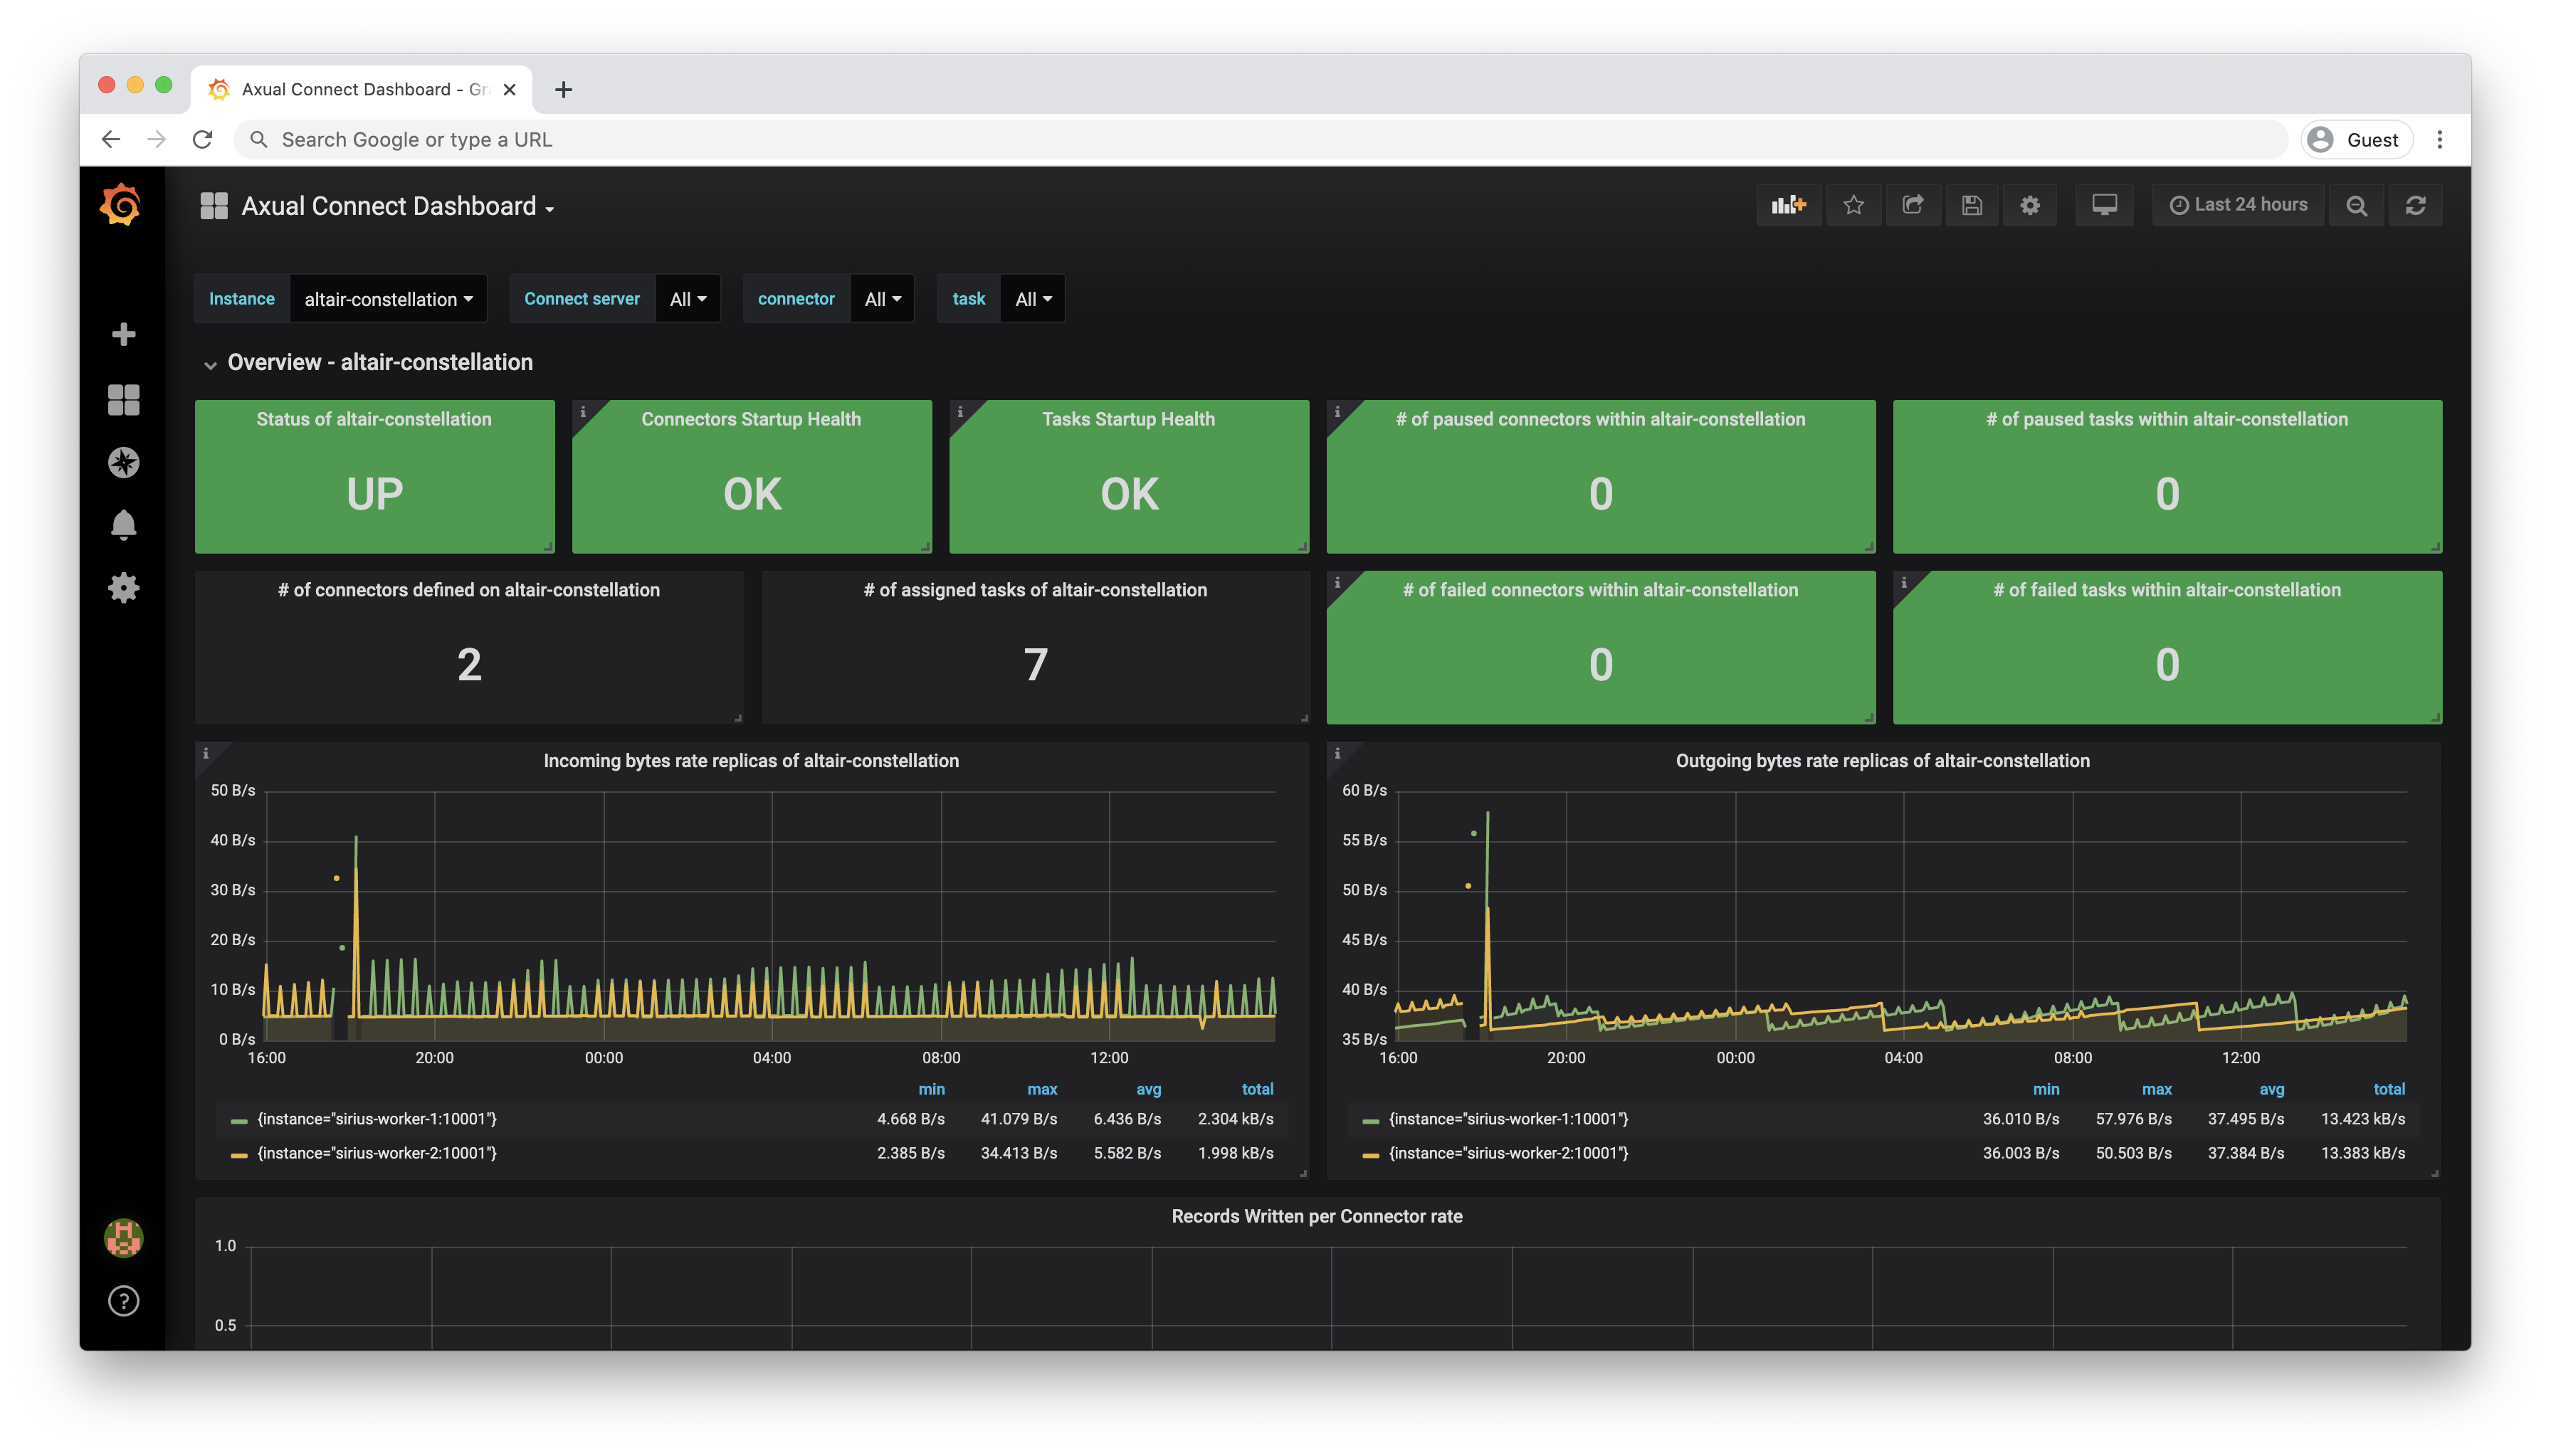
The views of this dashboard can be filtered by Instance / Connect Server / Connector / Task
Information found here:
-
Connect Overview (per instance):
-
Important - Connect Status per instance -
UP/DOWN/N/A -
Connector Startup Health -
OK/N/A -
Tasks Startup Health -
OK/N/A -
Number of Paused/Failed Connector/Tasks per instance
-
Number of Defined Connector per instance
-
Number of Assigned/Failing/Paused connectors/tasks per instance
-
Incoming/Outgoing byte rate per instance
-
Record Poll/Write rates
-
-
List of Connectors Overview - A Generic overview of connectors running on the instance, as they appear in Connector Monitoring.
|
When connect is not configured for the specific instance the value will be |
Monitoring Connectors
Connector Dashboard exposes metrics that concern individual connectors.
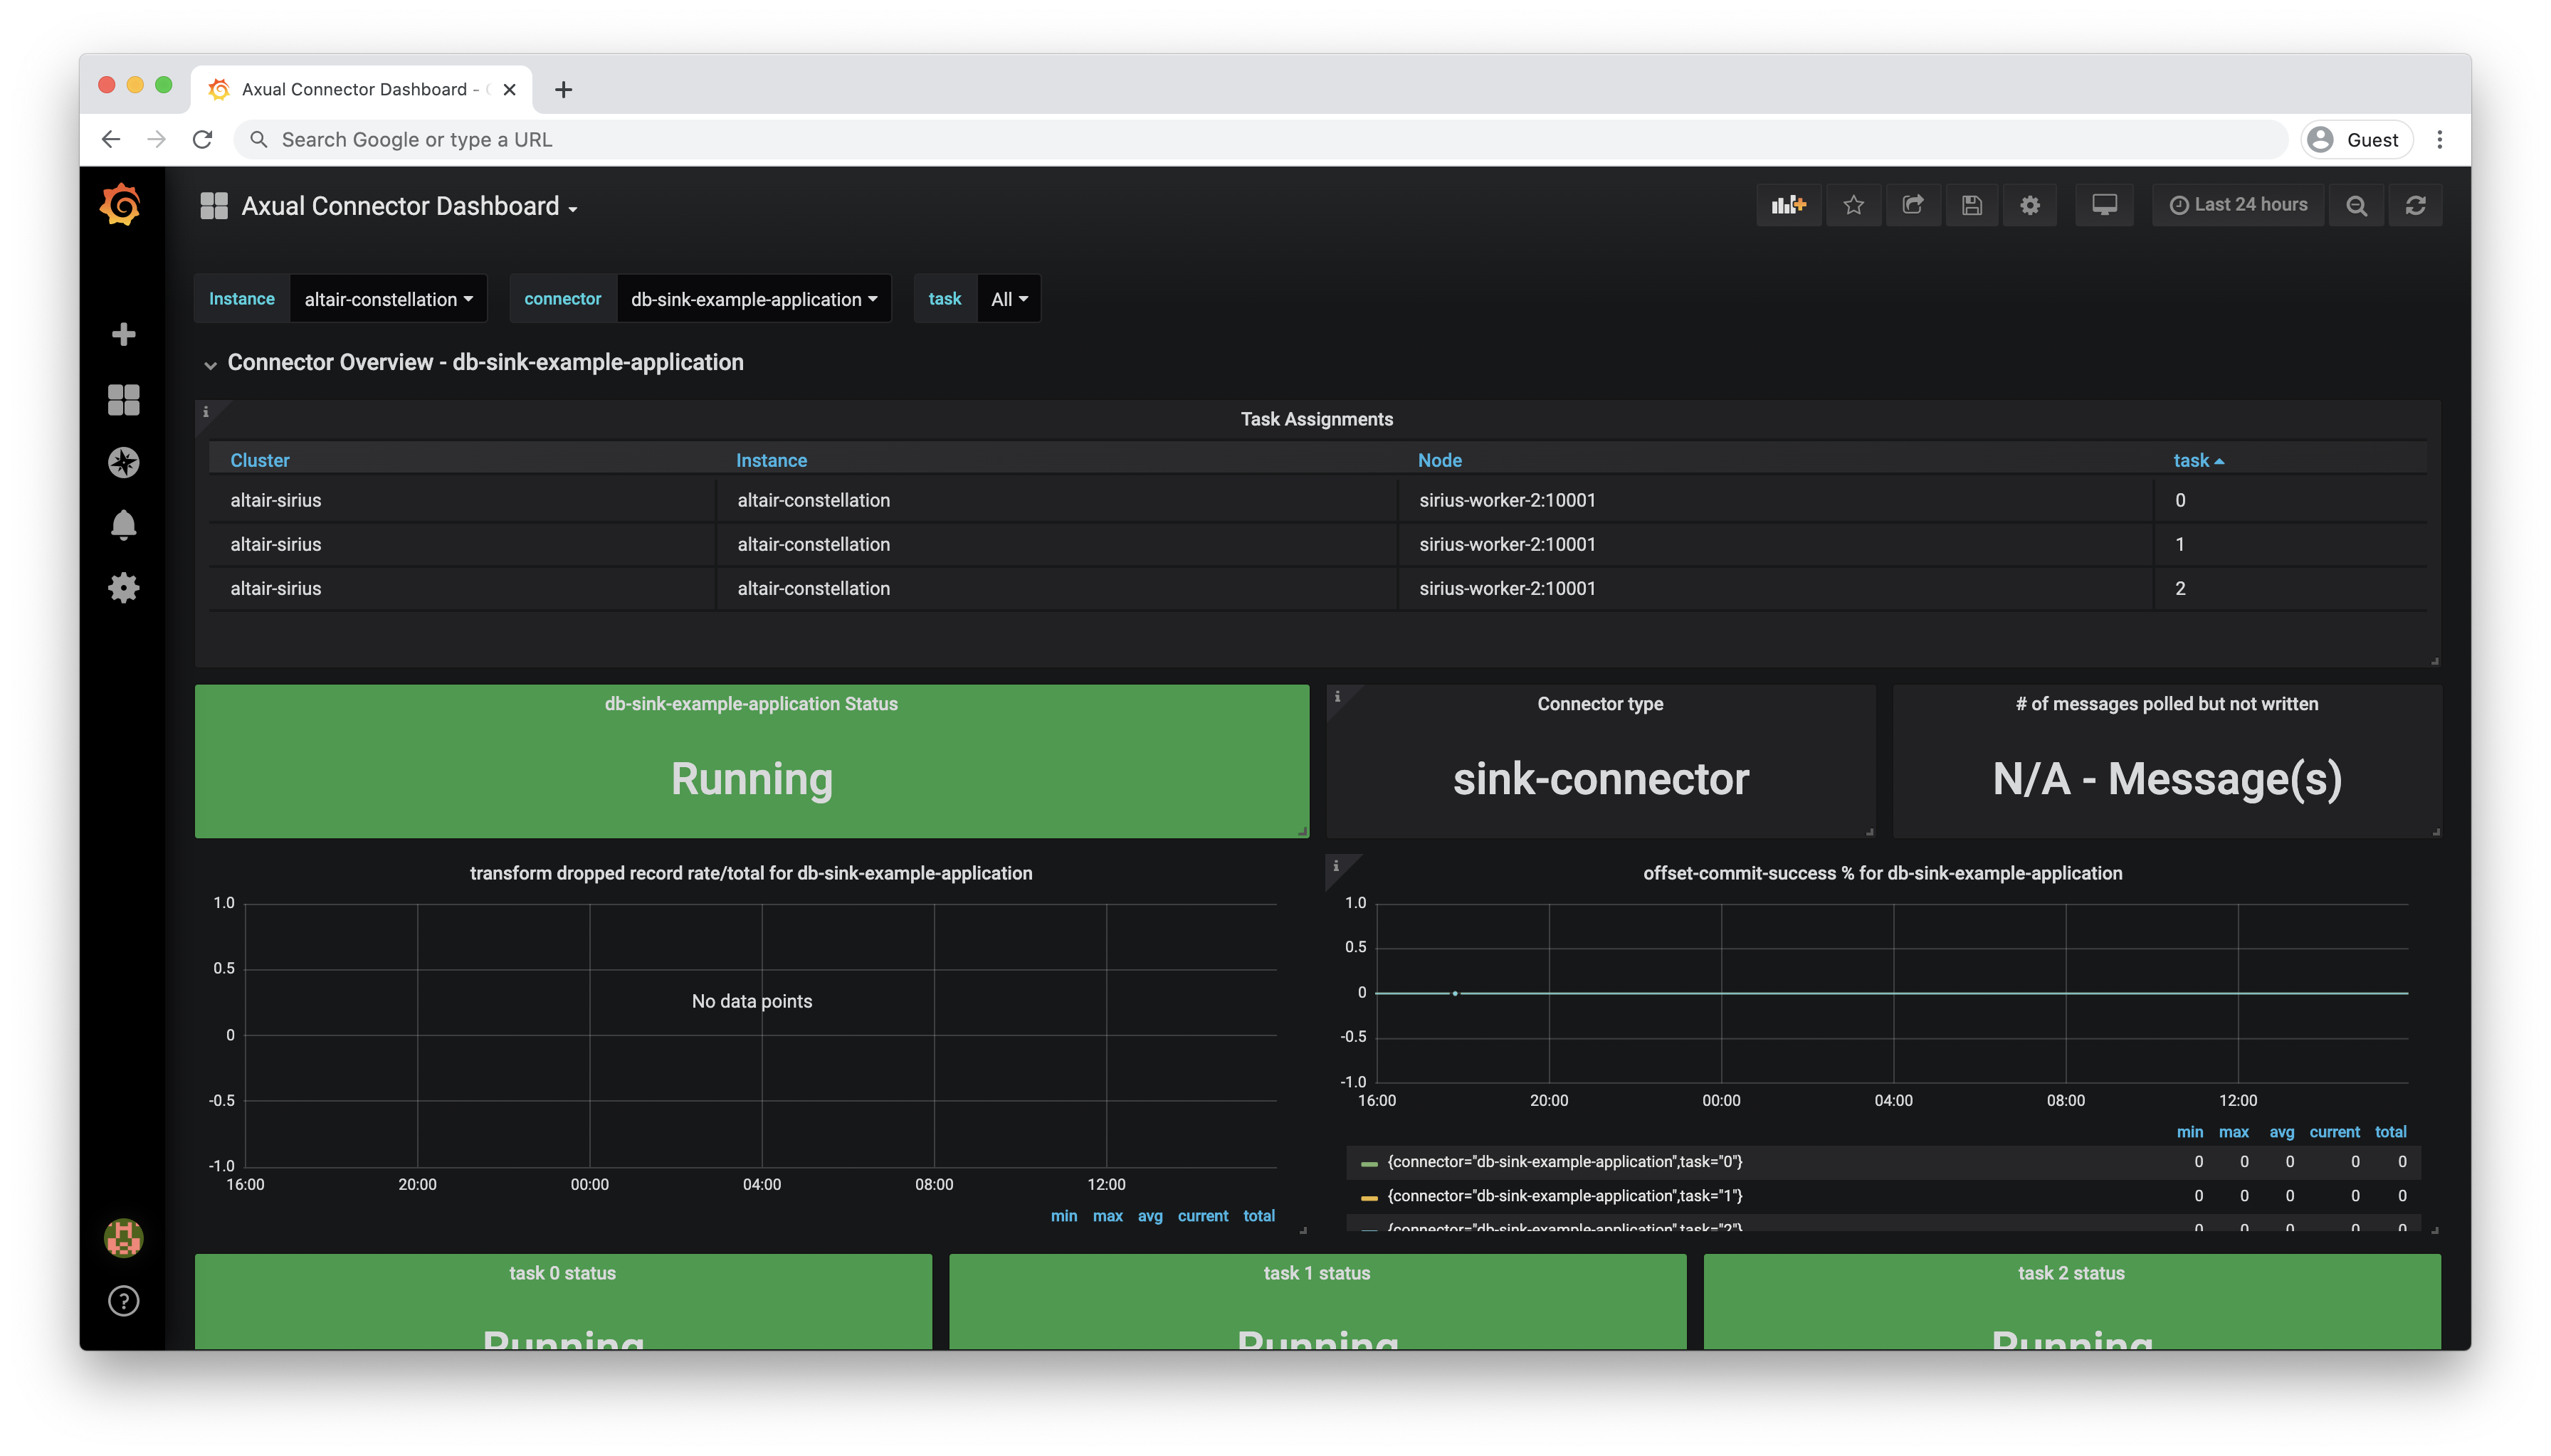
The views of this dashboard can be filtered by Instance/Connector/Task
Information found here (per connector) includes:
-
Connector Overview
-
Task Assignments - Shows the task assignments per Axual Connect node
-
Important - Connector status per task -
Running/Unassigned/Paused/Failed/Destroyed -
Connector type -
source-connector/sink-connector -
Number of messages polled but not written
-
Transform dropped record rate
-
Offset commit success rates
-
Important - Tasks status -
Running/Unassigned/Paused/Failed/Destroyed -
Connect Record poll rates
-
Record drop rates
-
Processed batch sizes
-
|
When the connector is not configured for the specific instance the value shown will be |
Connect logging
The Axual-Connect cluster
Connect to the Instance node where Connect is running
-
Option 1 - docker command
docker logs -f $tenant-$instance-axual-connect
-
Option 2 - Open the log file
system.login the following path
$LOG_DIR/$tenant-$instance-axual-connect/
|
The |
Connector logging
Each connector instance coordinates a set of Tasks that actually copy the data.
To see logs for a specific connector you will first need to find which nodes running the Tasks for the Connector, use the Monitoring Connectors dashboard to get the node name.
For each node, navigate to the following path, where you can find the connector log file - [CONNECTOR NAME].log
$LOG_PATH/$tenant-$instance-axual-connect/connectors
| Collect your logfiles in a central logging system to avoid logging into individual nodes to gather information about your connect nodes and connectors. |