Metrics Exposer
Metrics Exposer
The Metrics exposer is an Axual Service which is used to generate metrics for use in prometheus, or via API calls. The metrics exposer generates information on message rates, message sizes, stream size and other.
Building Dashboards
Metrics Exposer can be used as a datasource for dashboards and can be integrated with any visualisation tool. Next section would provide an example on how to integrate Metrics Exposer with Grafana.
Grafana Integration
Installing a plugin
Go to Configuration > Data sources > Plugins and install plugin called Infinity. This plugin provides a way to create a datasource using HTTP POST method, which is used by Metrics Exposer.

After installation click on "Create a Infinity data source" and proceed to the datasource.
Datasource Configuration
Let’s configure our datasource:
in "Authentication" tab:
-
Auth type - choose Bearer token
-
Bearer token - retrieve an access_token from Keycloak for a client with scope "metrics-exposer" and insert it here
-
Allowed hosts - provide a host url, where Metrics Exposer is available
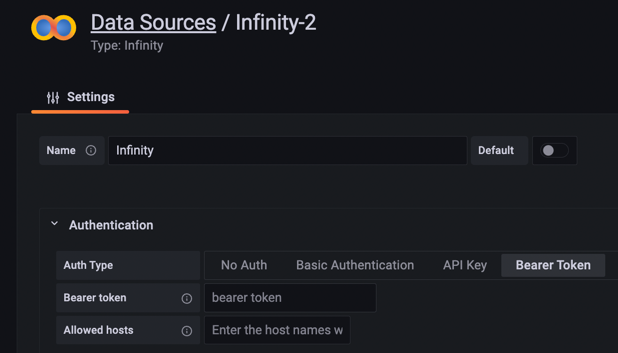
Press "Save & test". Now, you are ready to create a personalized dashboard and a panel.
Creating a Dashboard
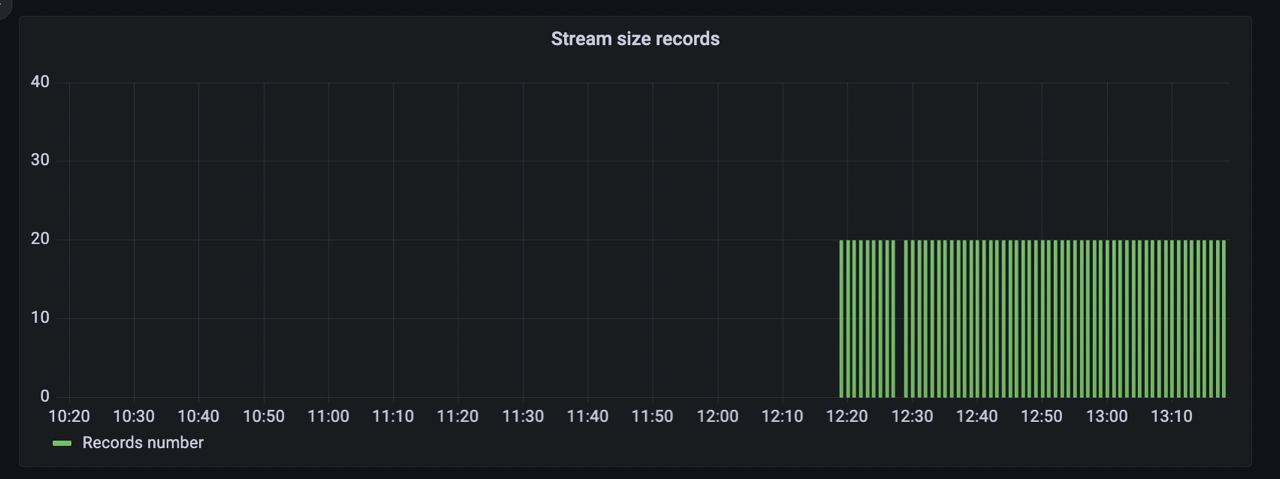
One Dashboard can have as many Panels as you like, they can be used for alerting or for visualization. Let’s create a panel, so we would see some data of our stream.
Go to Dashboards > + New Dashboard > Add New Panel
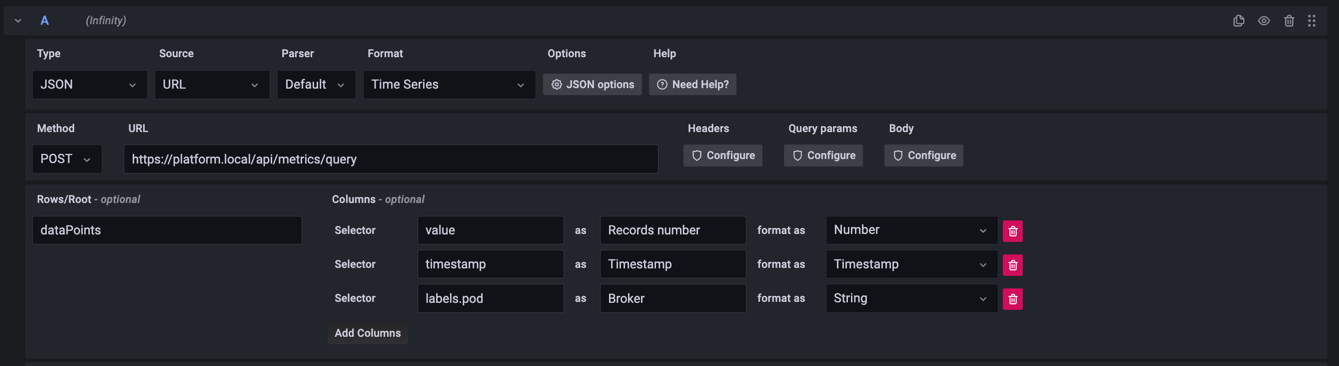
You will see a query configuration as below:
-
Set format to Time Series
-
Set method to POST
-
Update URL to your host installation
-
Configure Body with the metric request you want to be in the dashboard, e.g.:
{
	"metric": "io.axual.stream/size_records",
	"groupBy": [],
	"stepSize": "PT1M",
	"timeWindow": "PT1H",
	"filter": {
		"type": "AND",
		"filters": [{
				"type": "FIELD",
				"field": "environment",
				"operation": "EQUALS",
				"value": "dev"
			},
			{
				"type": "FIELD",
				"field": "stream",
				"operation": "EQUALS",
				"value": "payment-events"
			}
		]
	}

}| Don’t forget to change Body Content Type to the JSON format |
-
Based on your chosen metric and the response data structure can vary, so set columns and rows (
dataPointsorgroups) to be parsed accordingly.
After that, you should be able to see data points in your Grafana Panel.
Further panels configuration guides can be found here