Dashboards
Available monitoring dashboards
Axual makes the assumption that each client will have their own monitoring environments already available. Grafana and Prometheus are standard monitoring environments that Axual exports statistics and dashboards for.
Grafana dashboards are automatically provisioned when starting Axual. The following dashboards are available to monitor the platform:
Dashboard name |
Screenshot |
Contents |
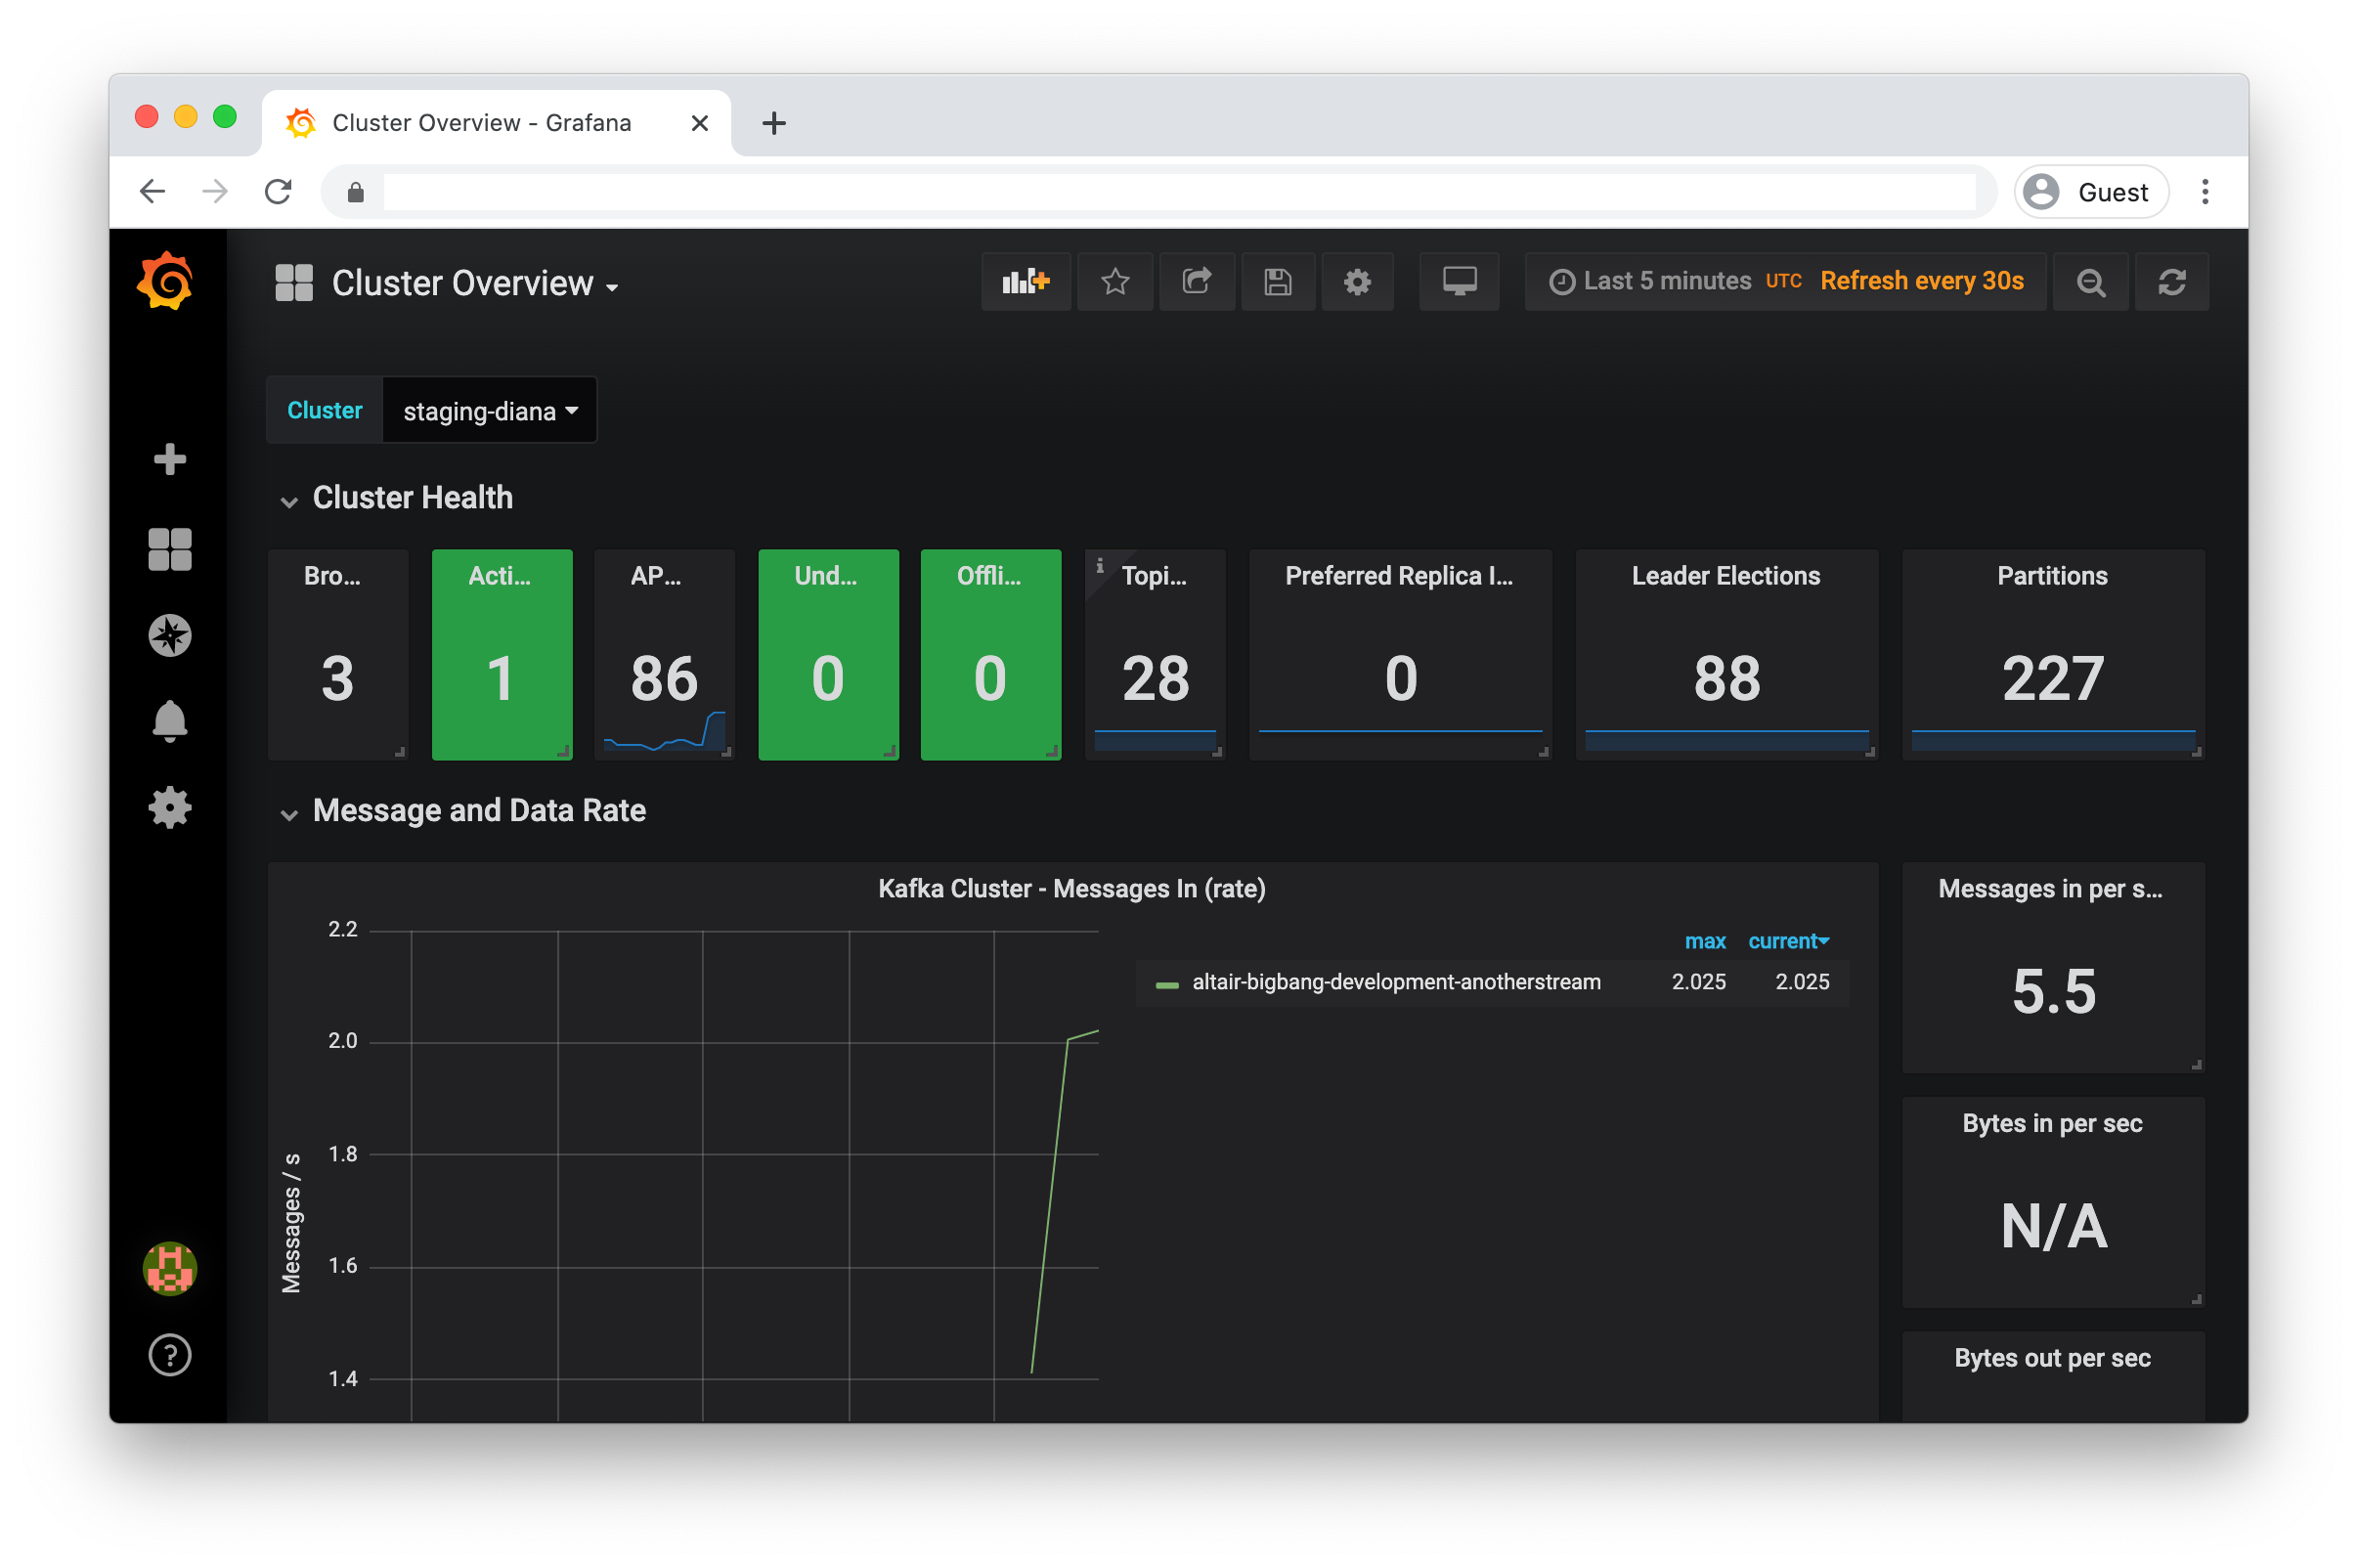
Cluster Overview |
|
A high level dashboard showing the cluster status and metrics |
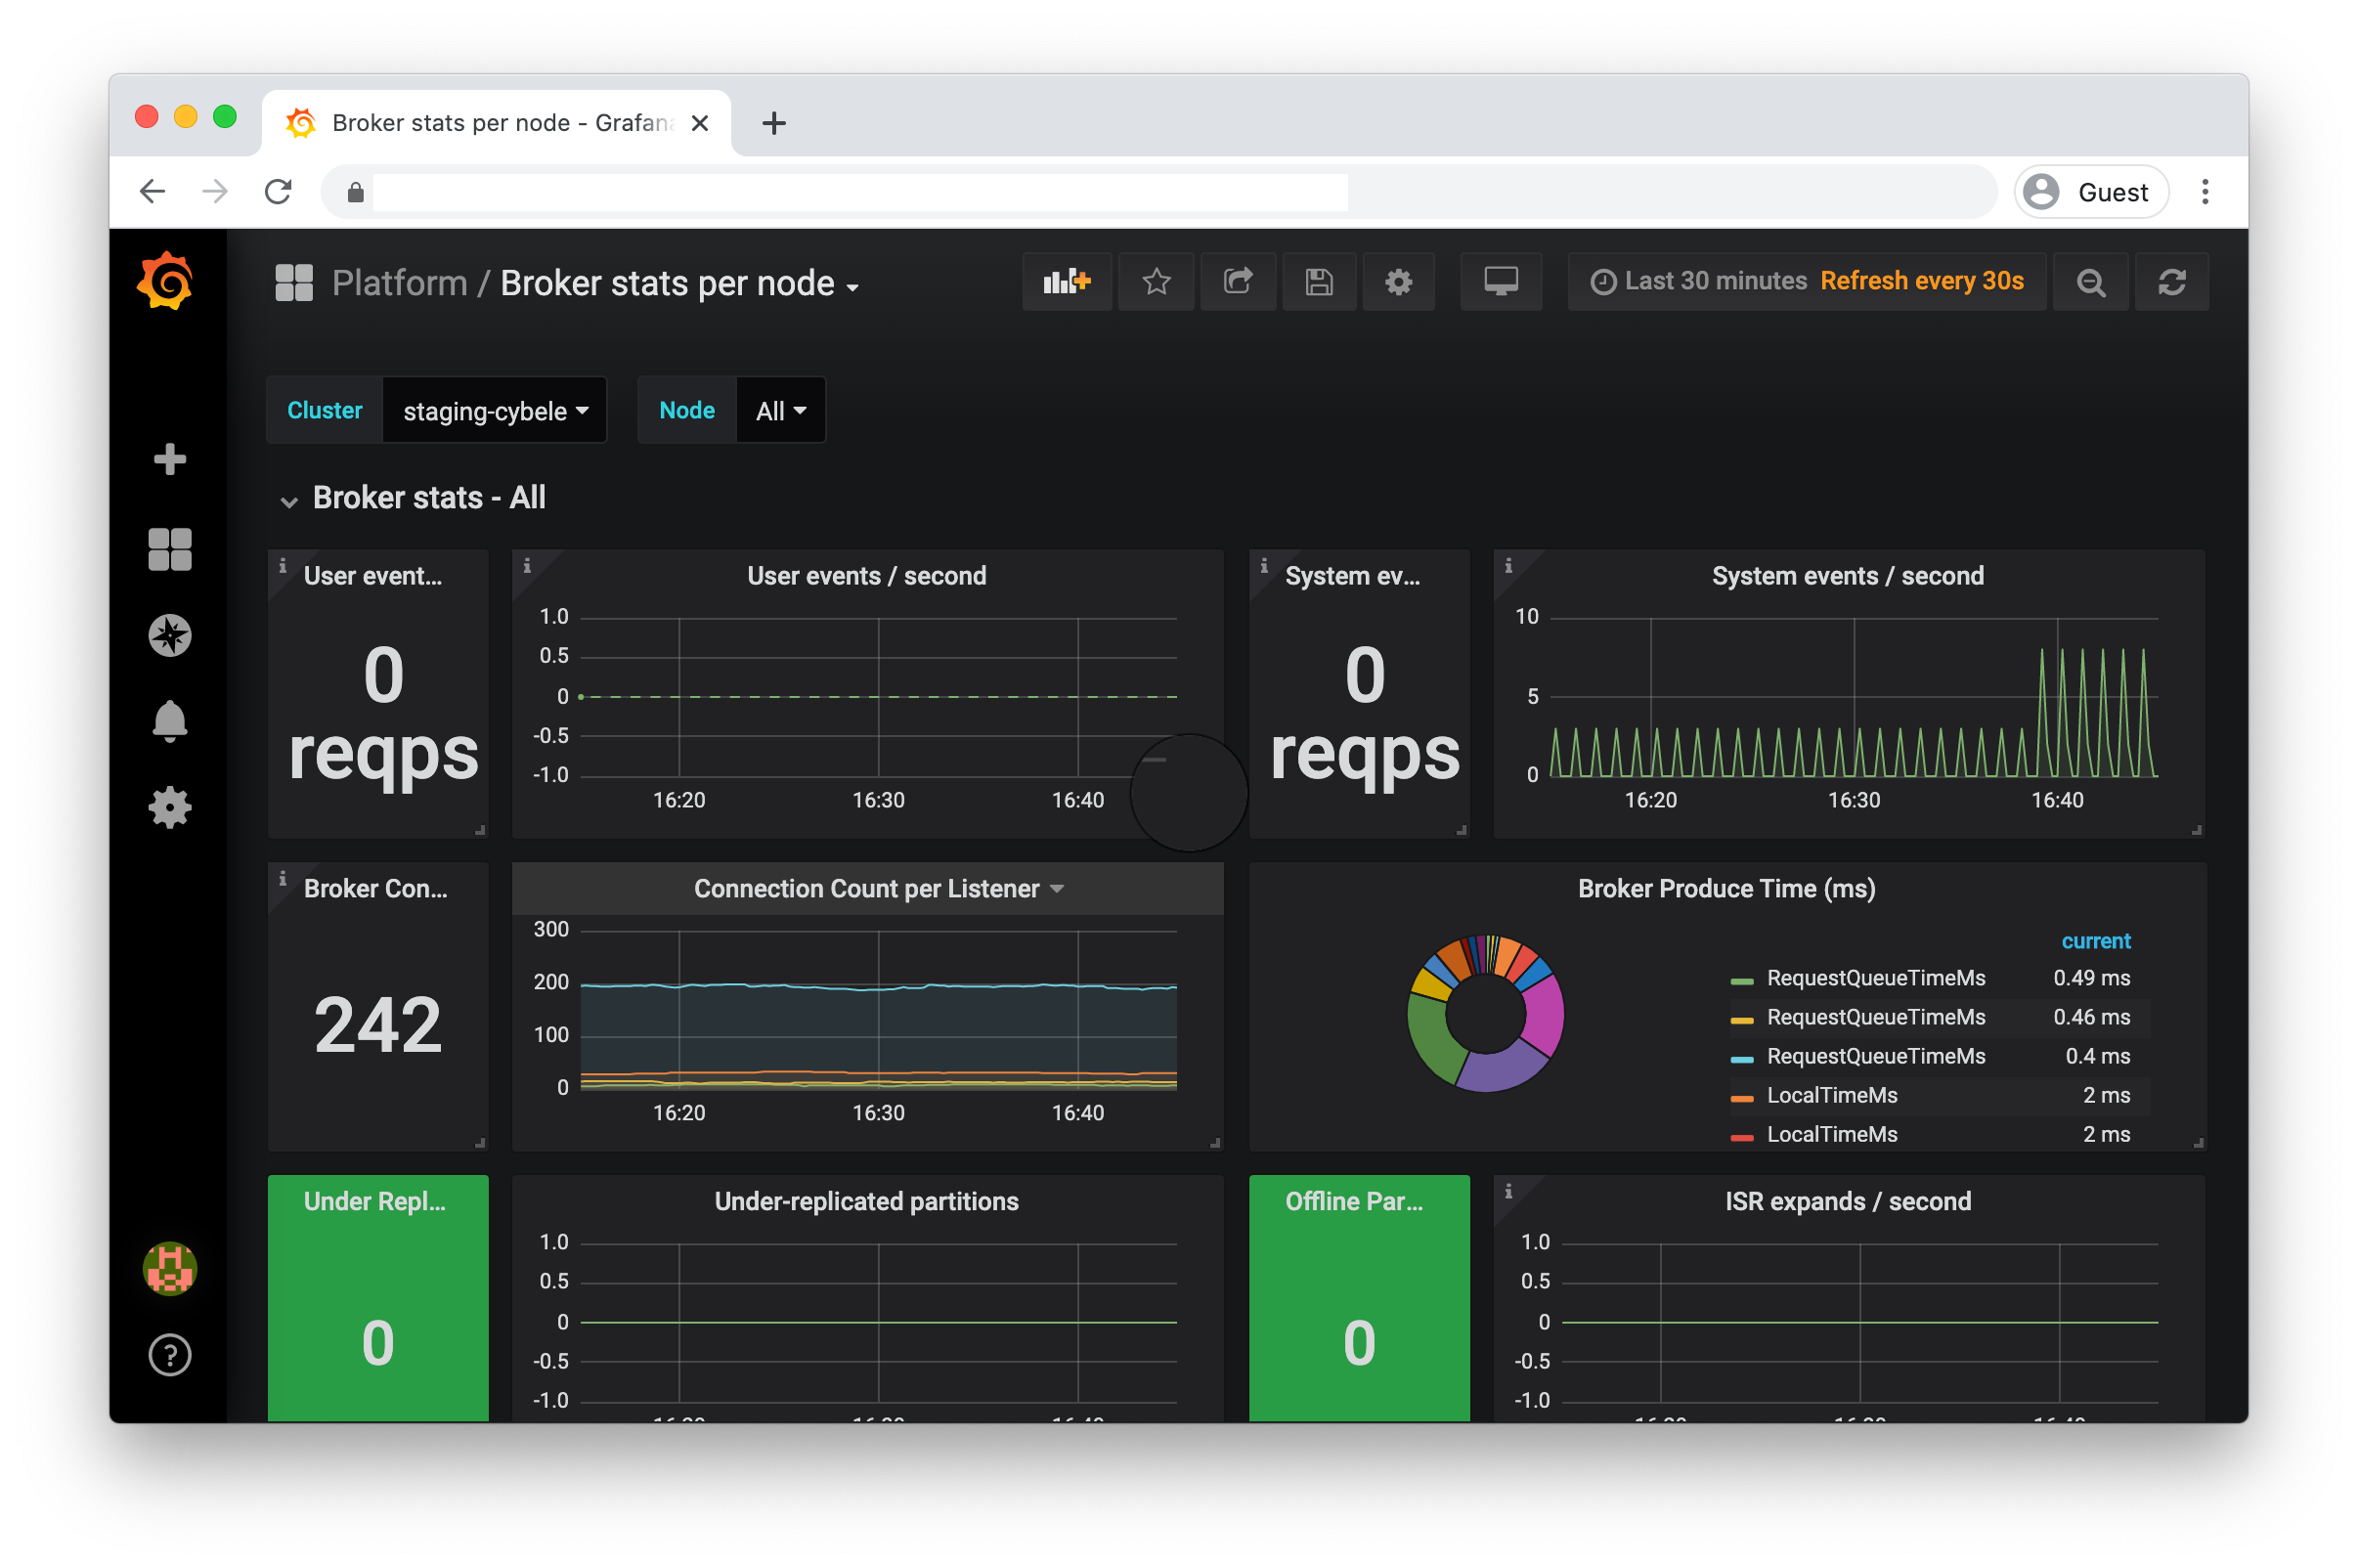
Broker stats per node |
|
A dashboard useful to zoom in to the metrics for a single broker node |
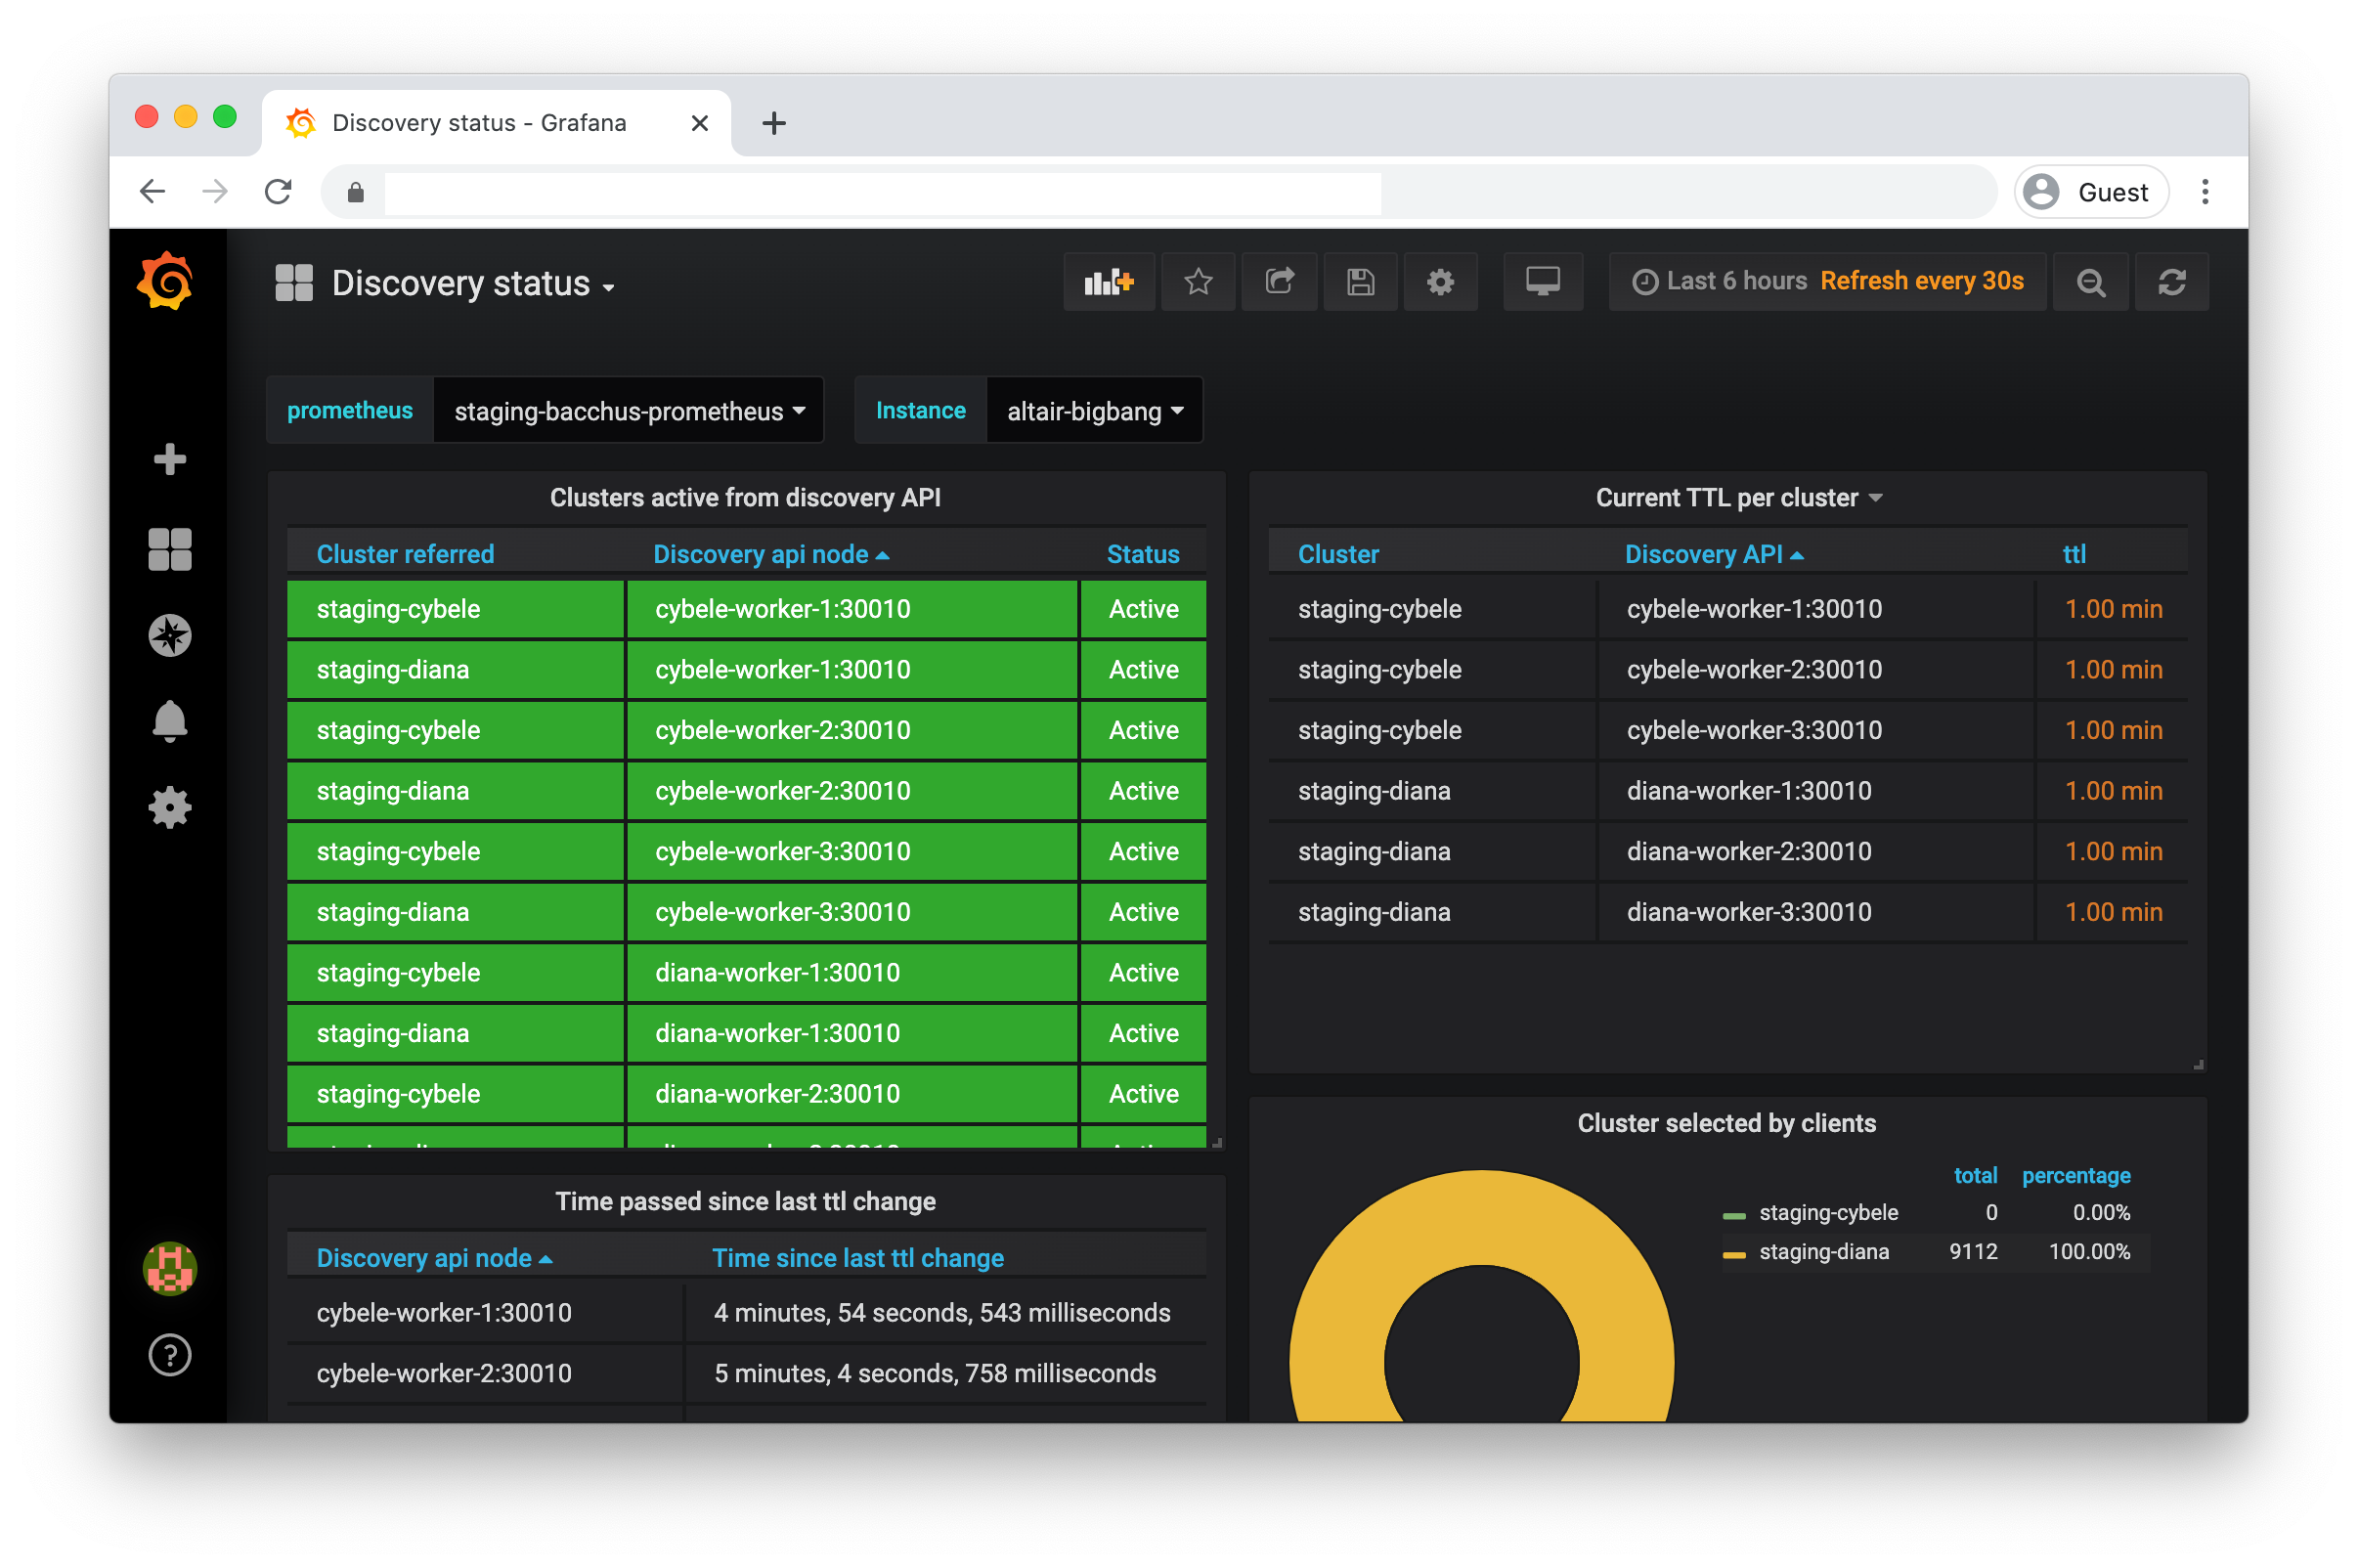
Discovery status |
|
A dashboard showing the (instance specific) status of the Discovery API and other metrics |
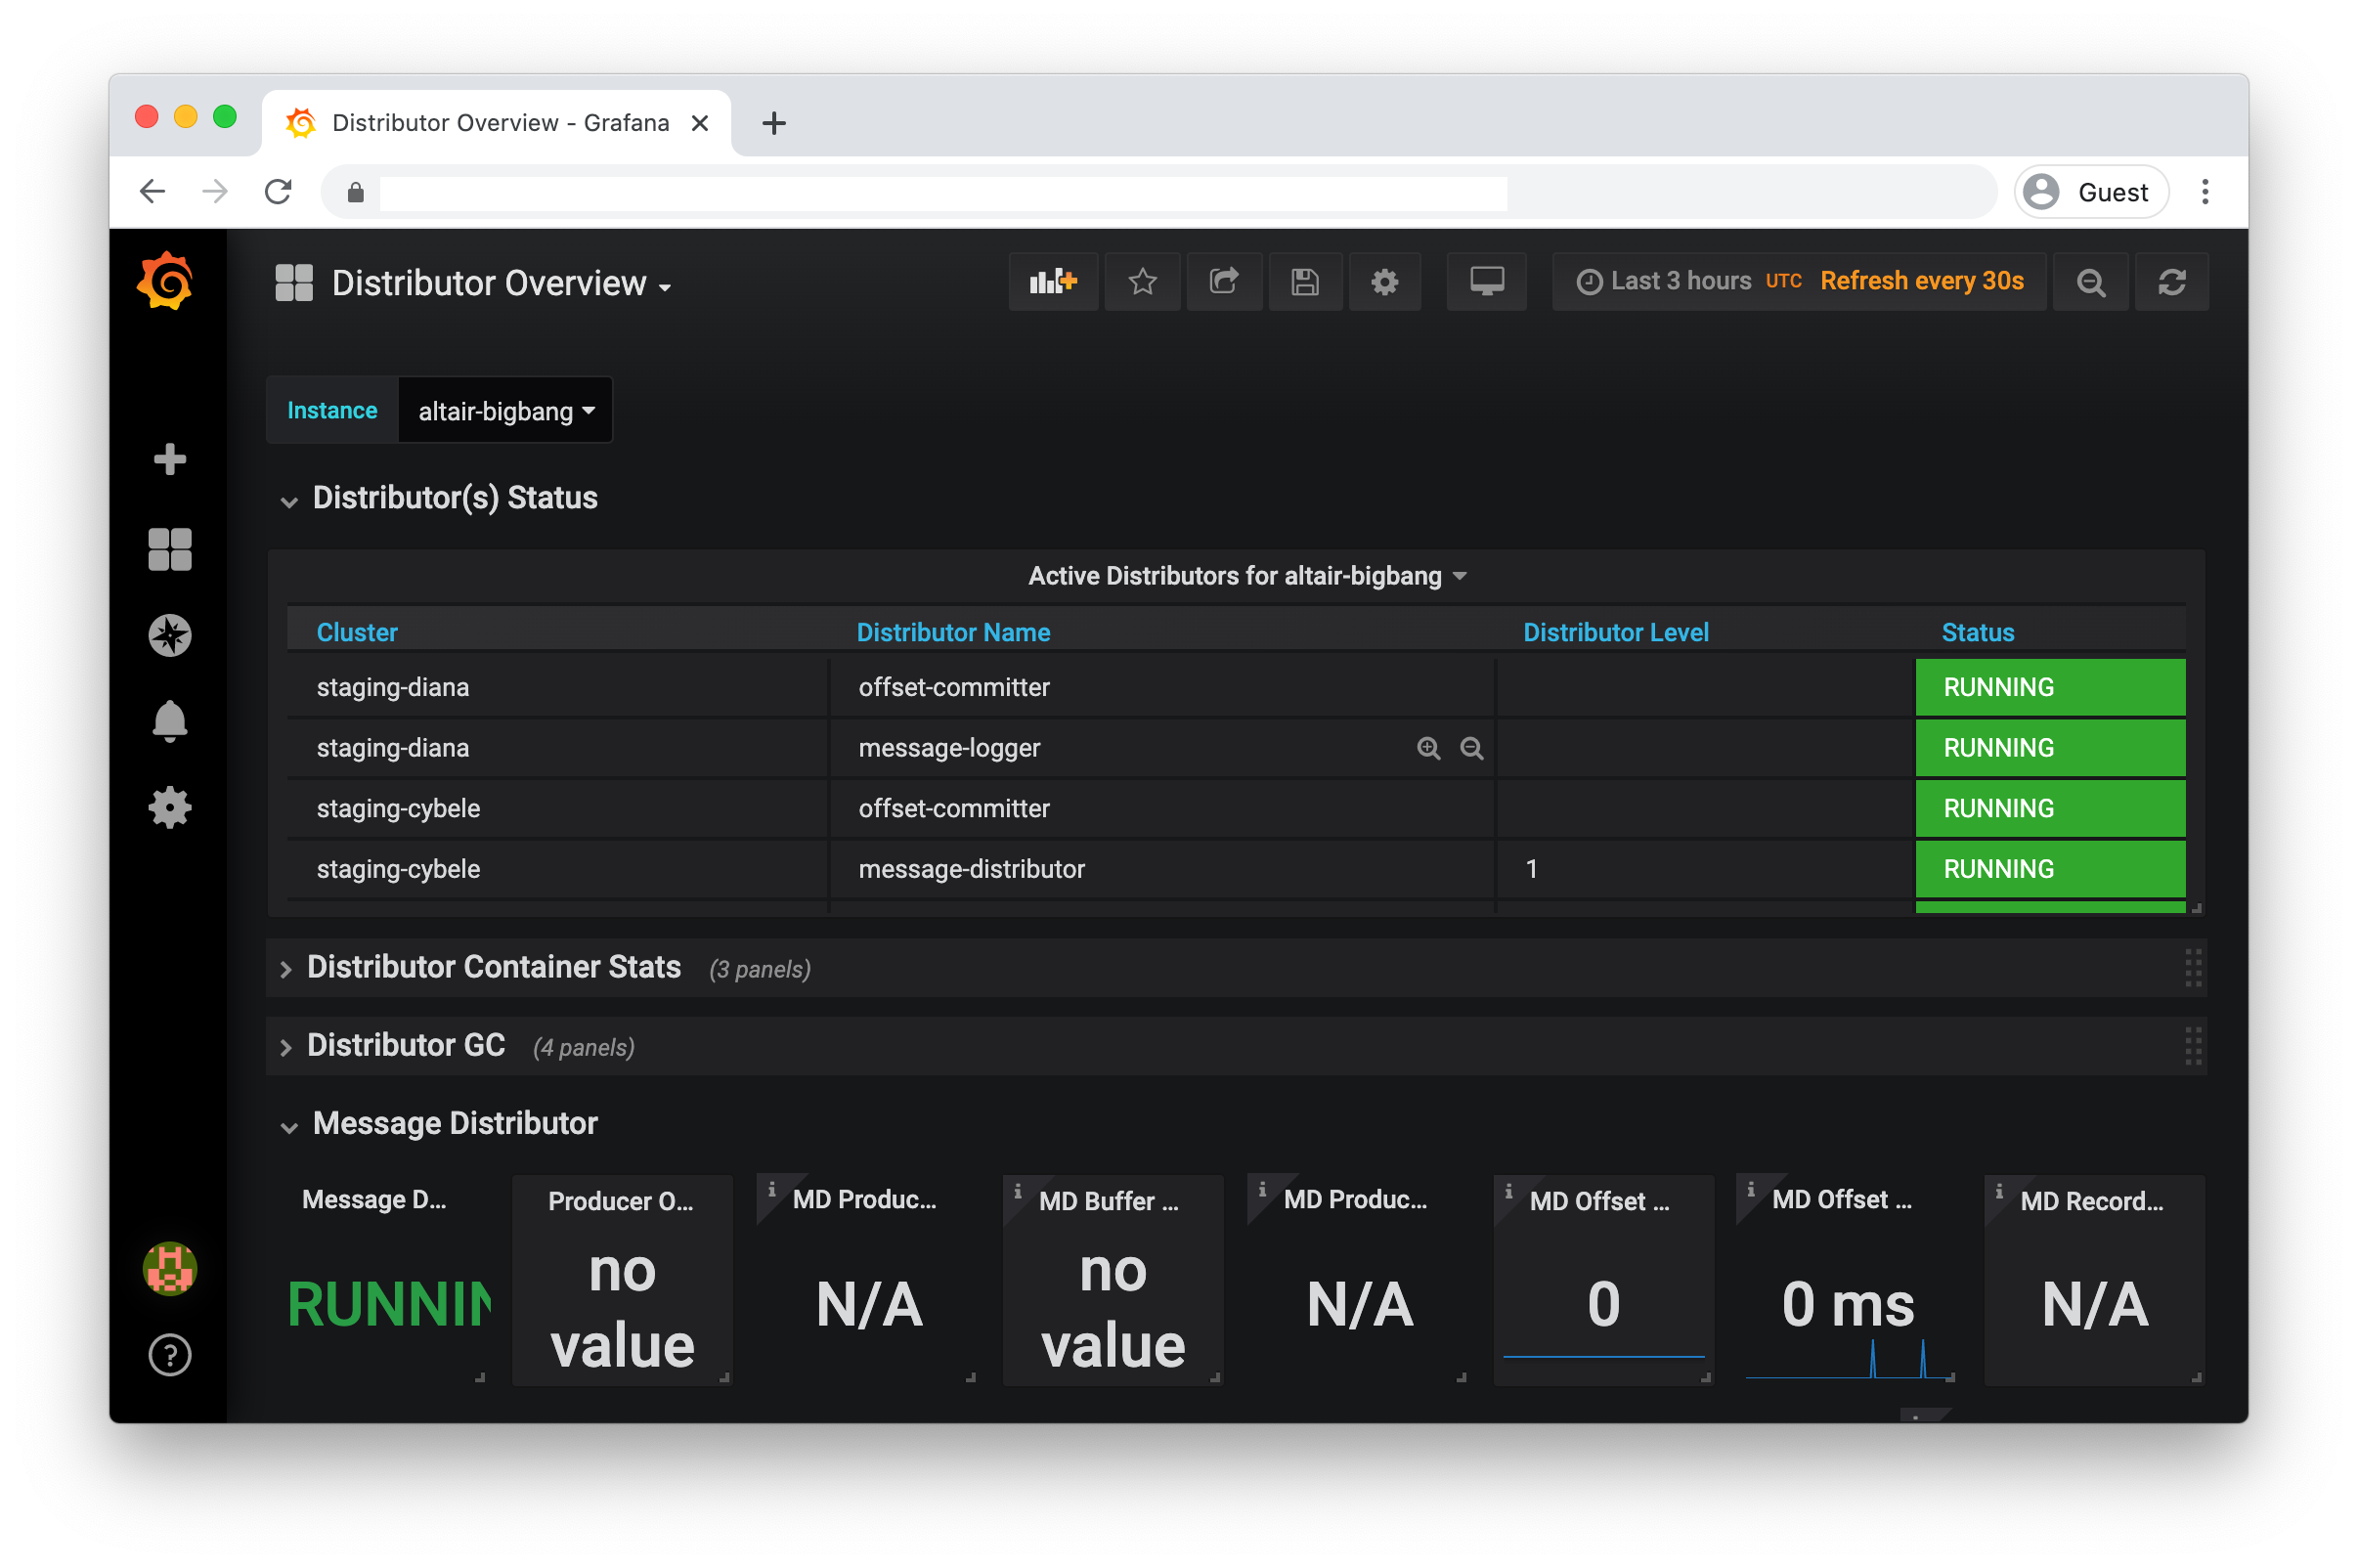
Distributor Overview |
|
Dashboard showing offset, schema and message distributor status and metrics |
VM Stats |
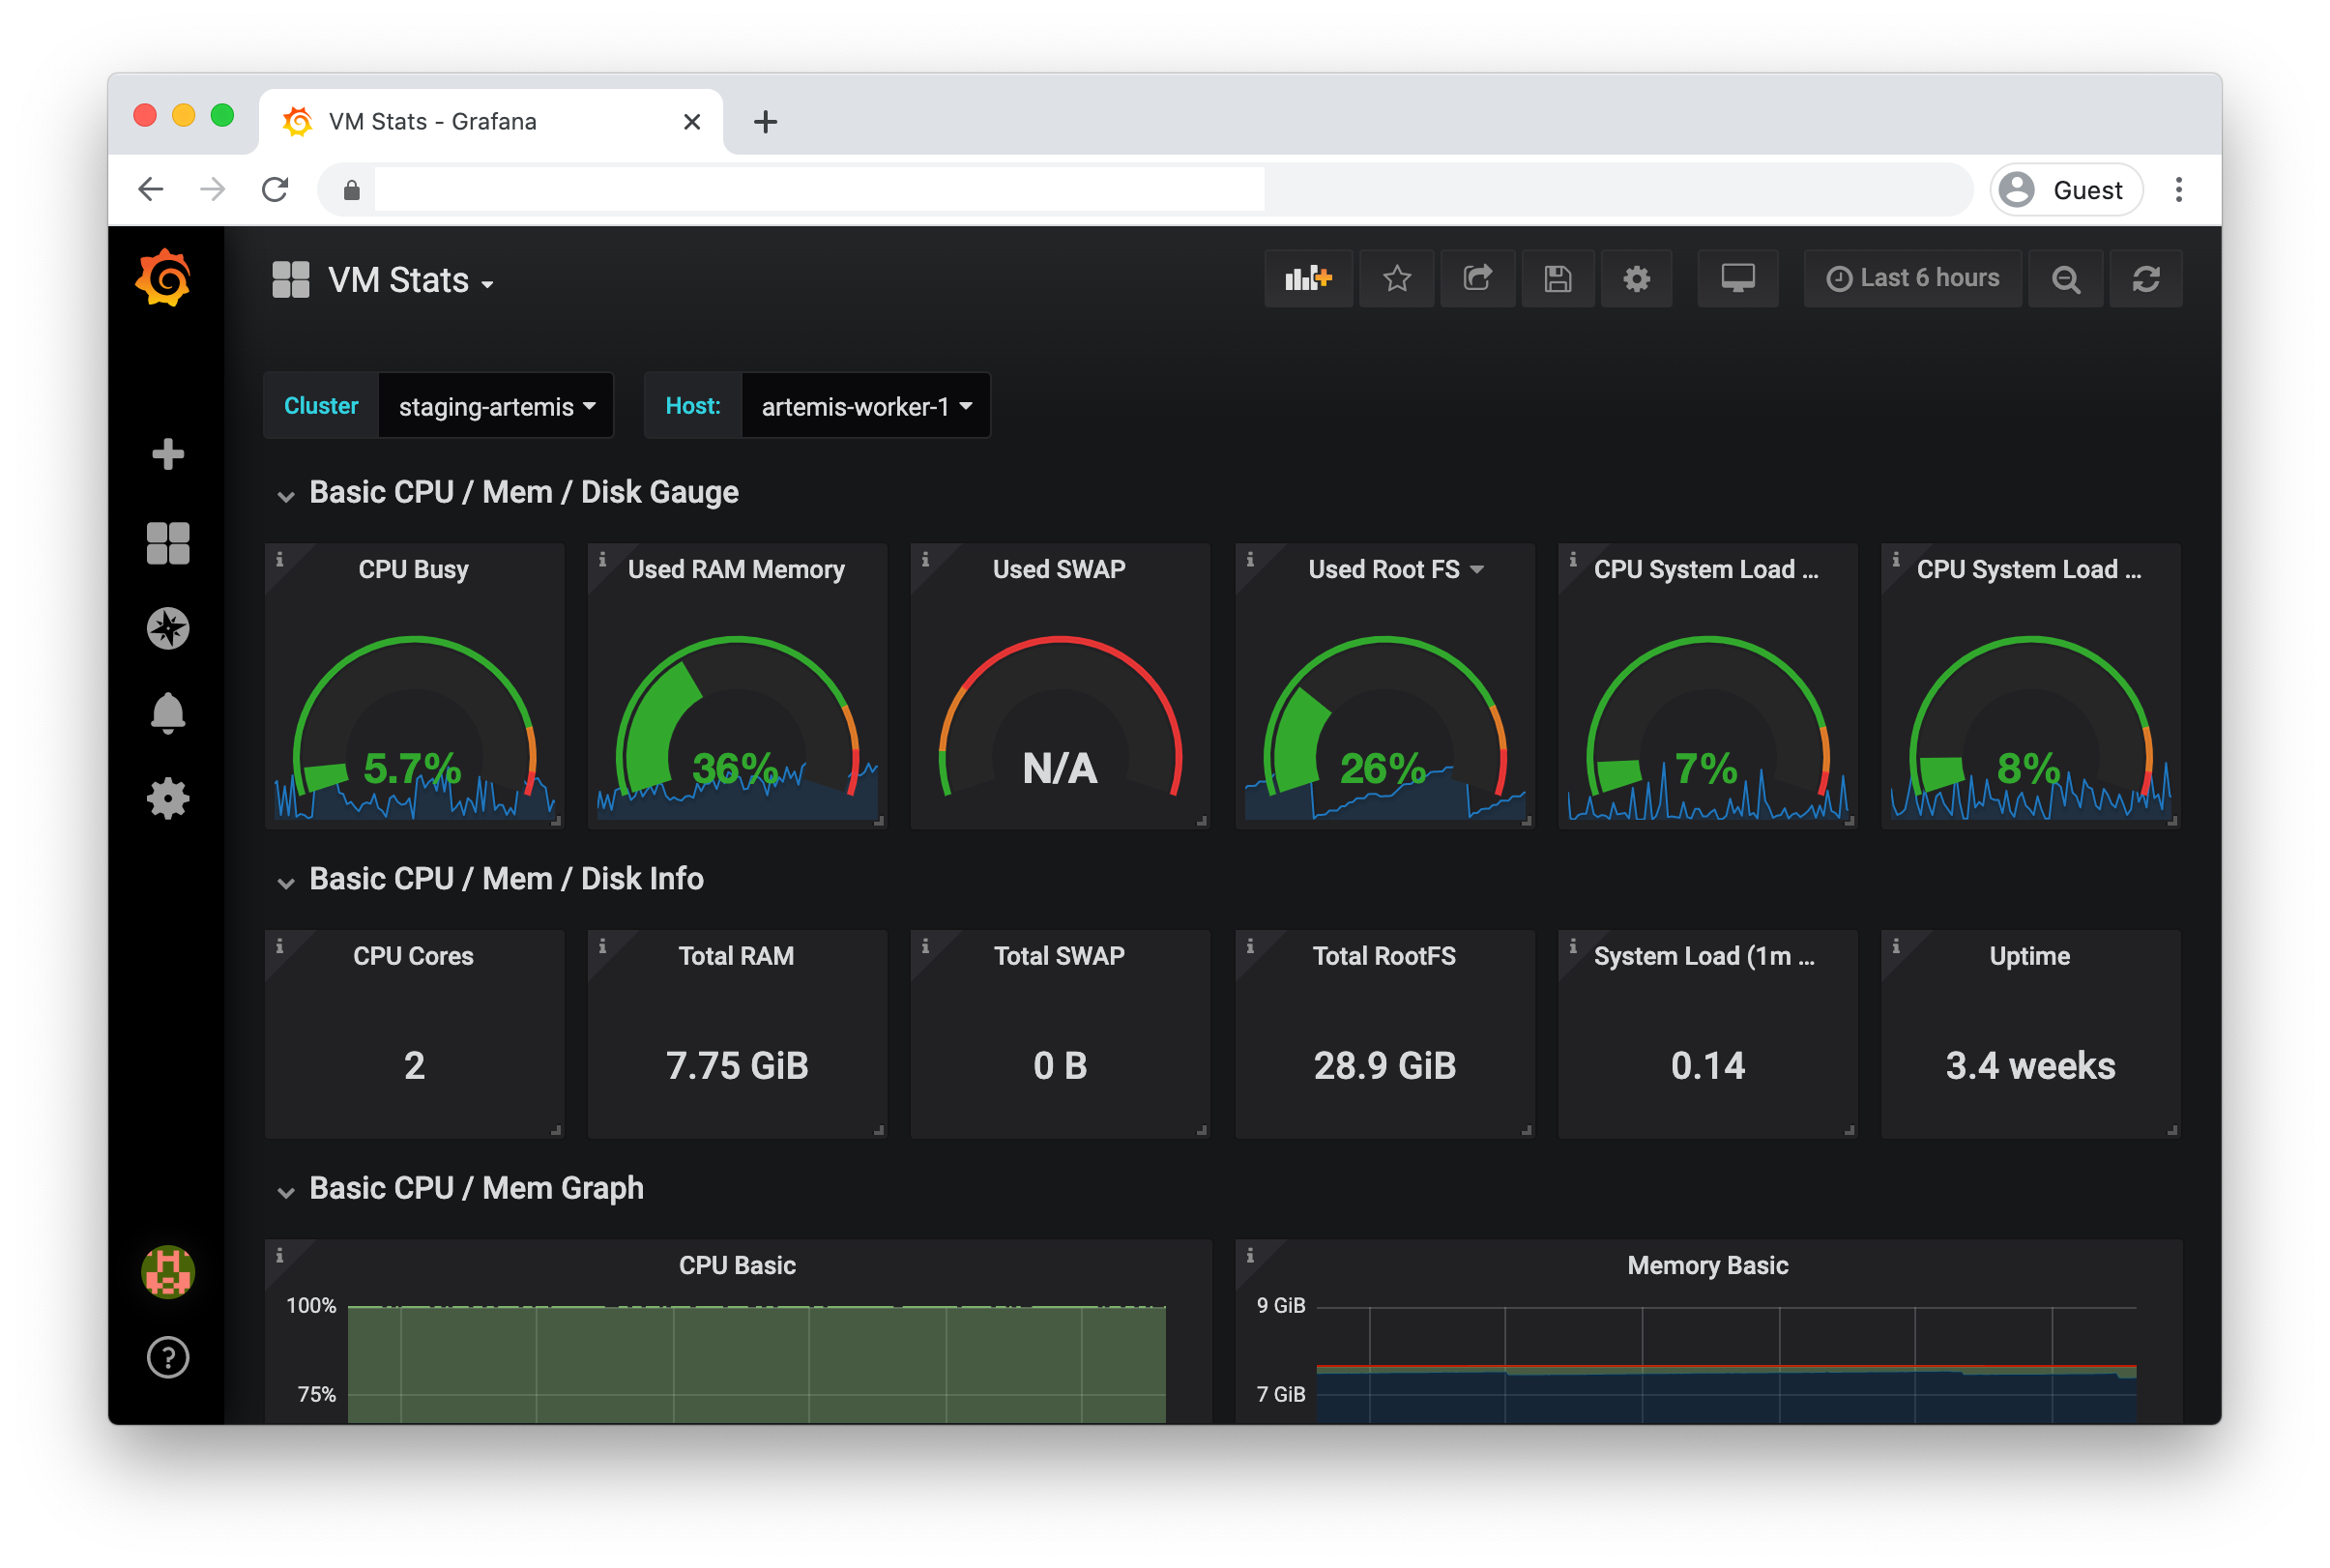
|
A useful dashboard to show a VM’s status, e.g. disk, CPU and memory usage |
Docker Monitoring |
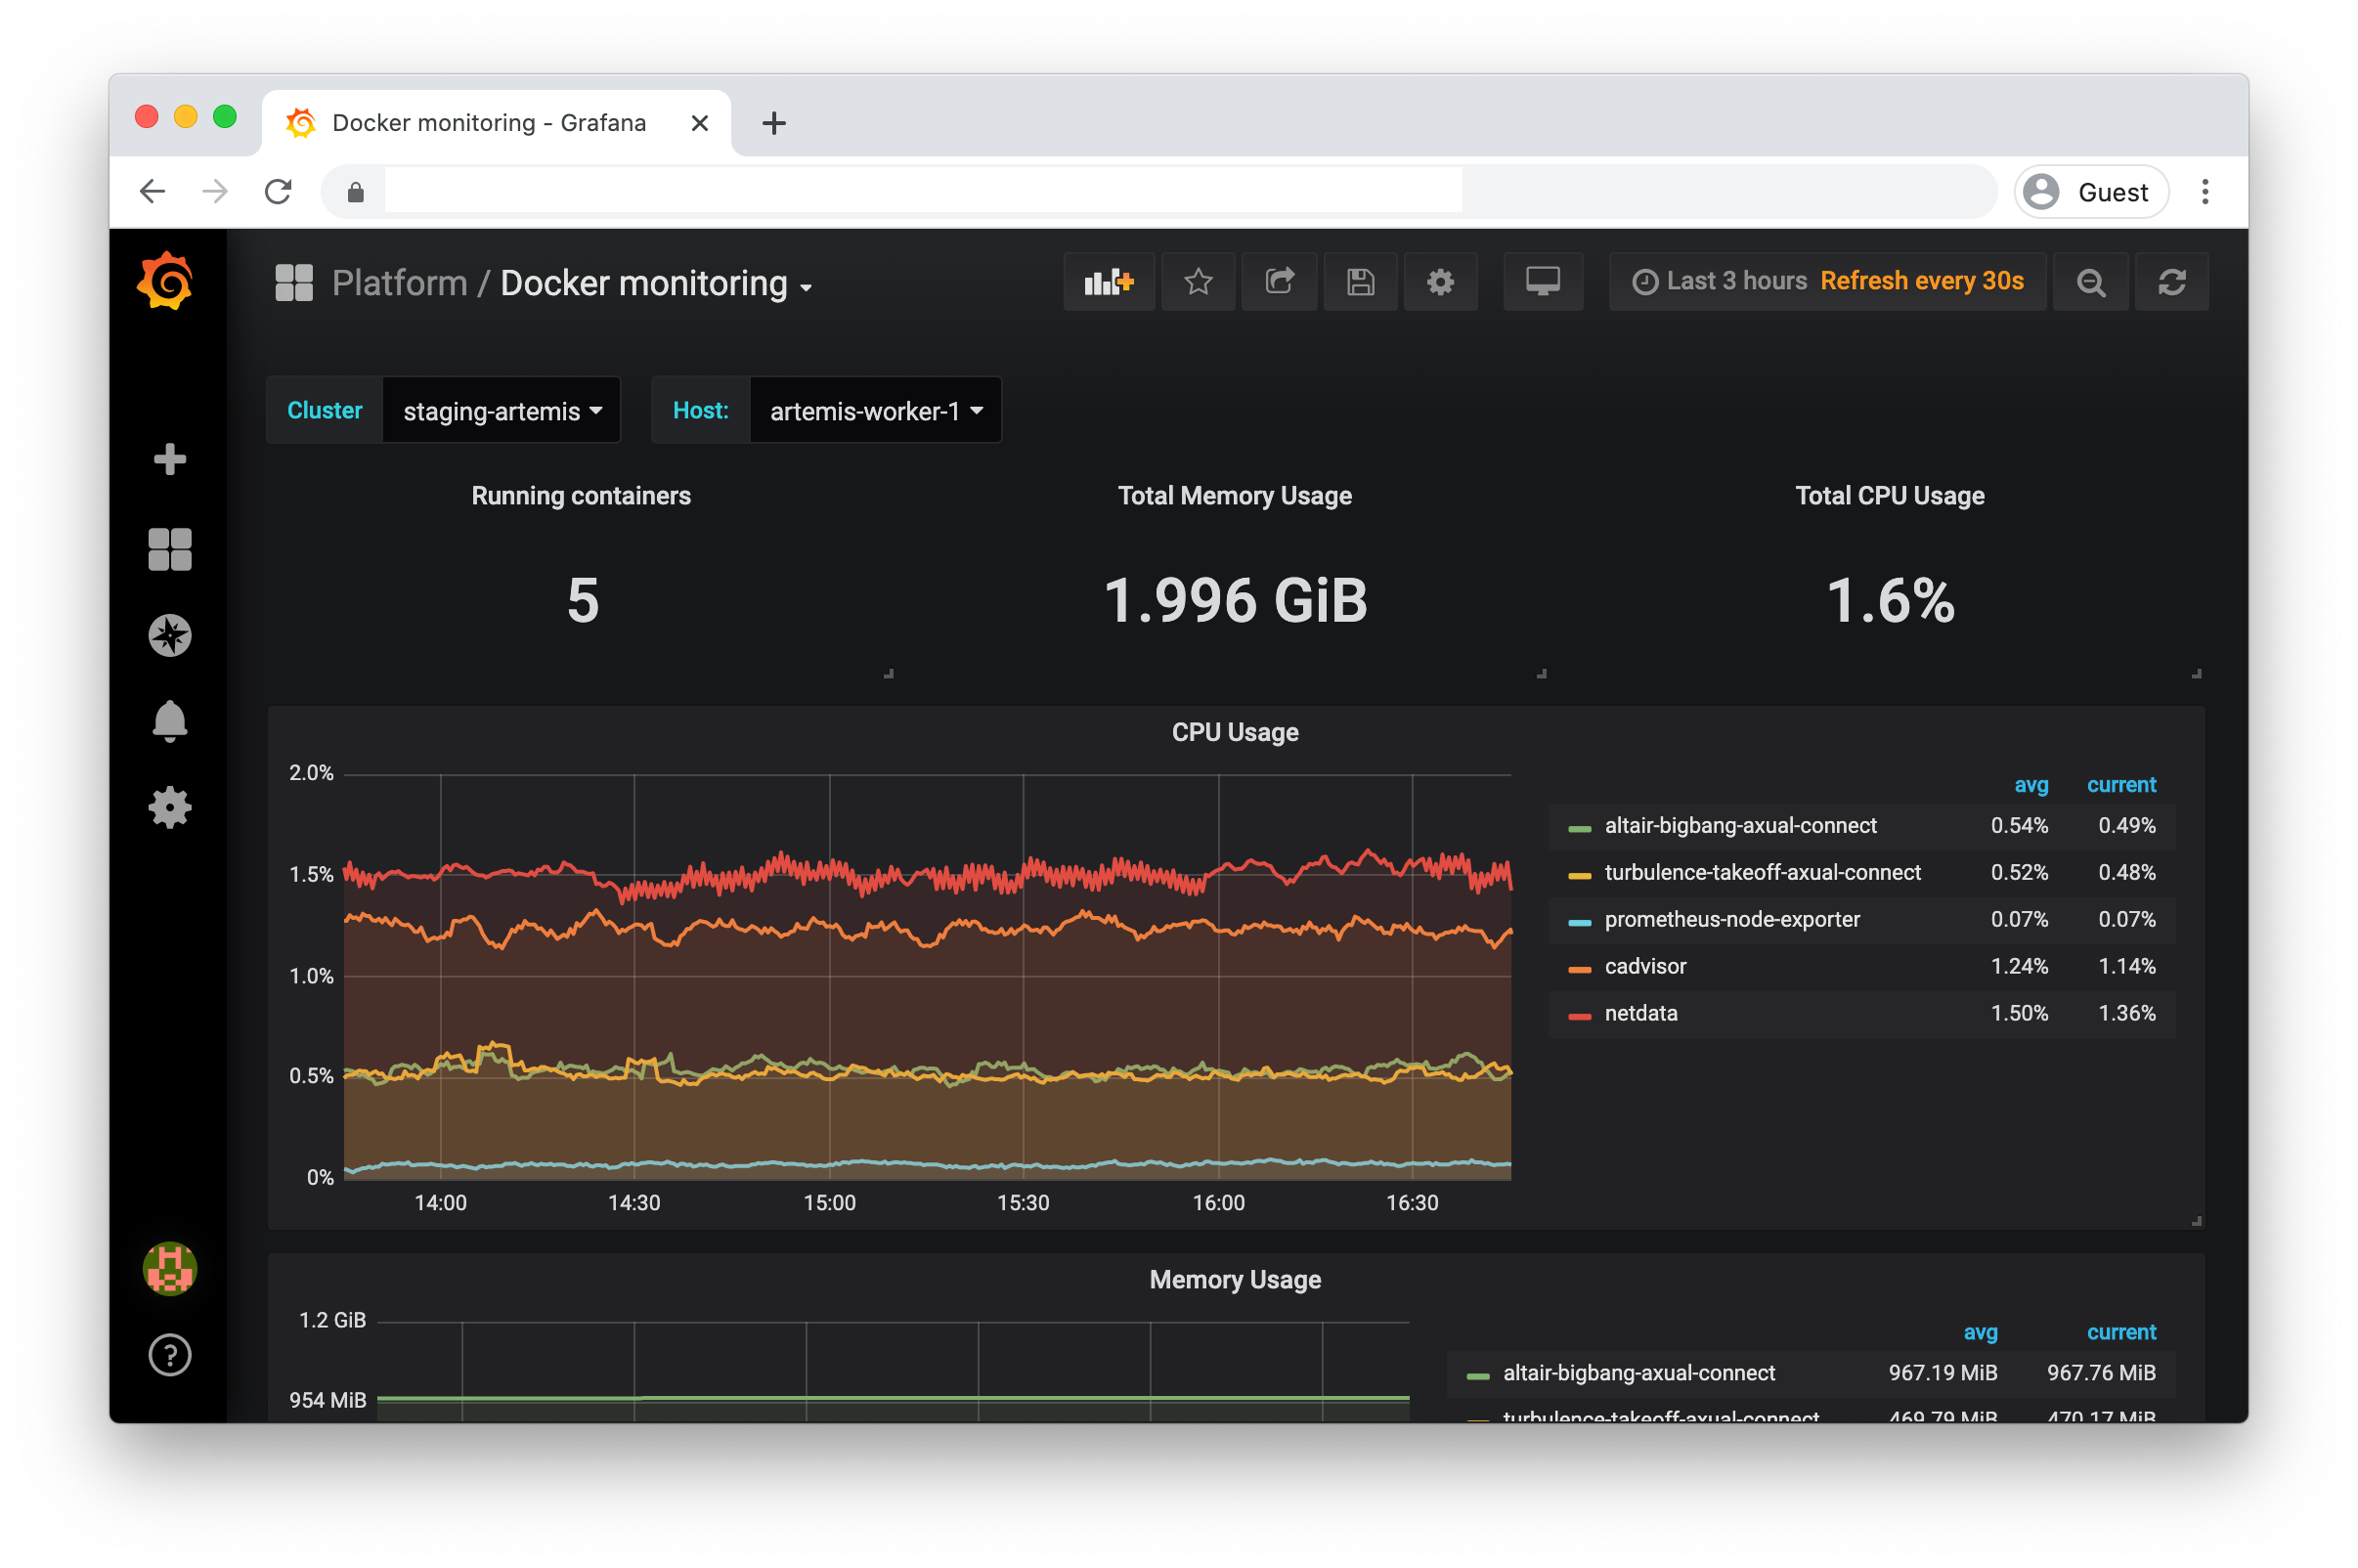
|
Dashboard zooming in on the Docker statistics of the VMs |
Prometheus Overview |
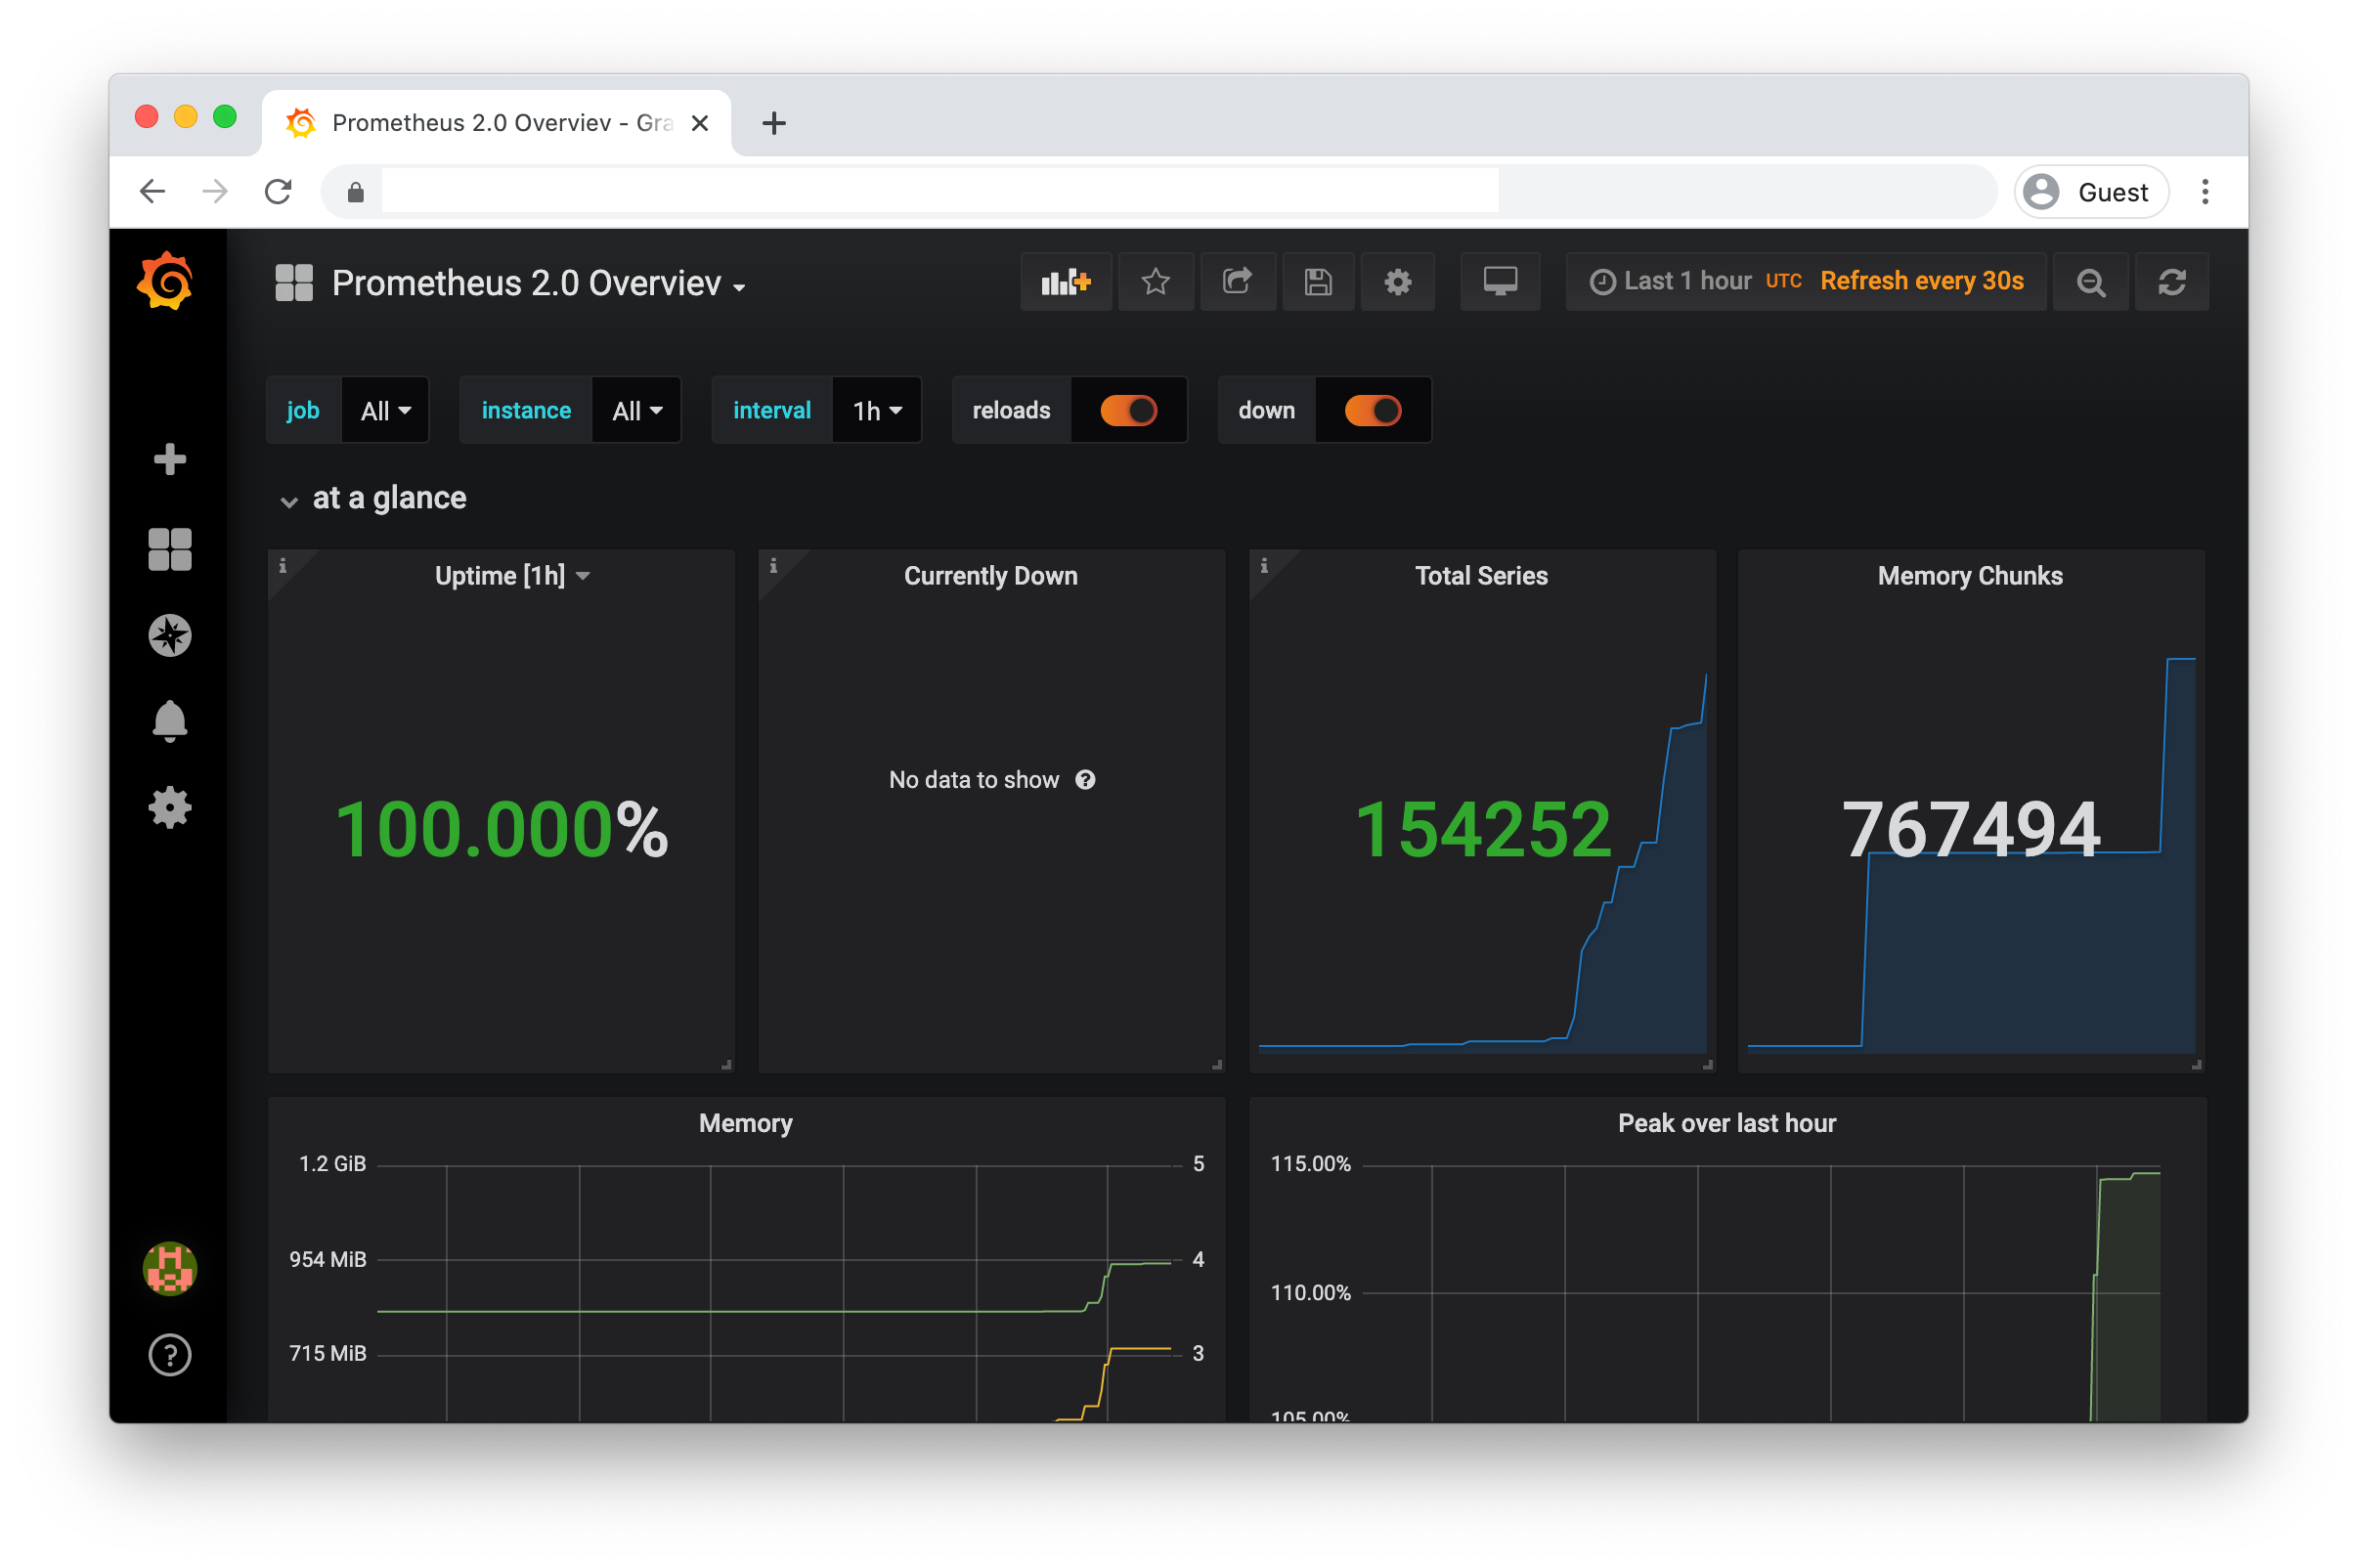
|
Dashboard used for checking Prometheus metrics |
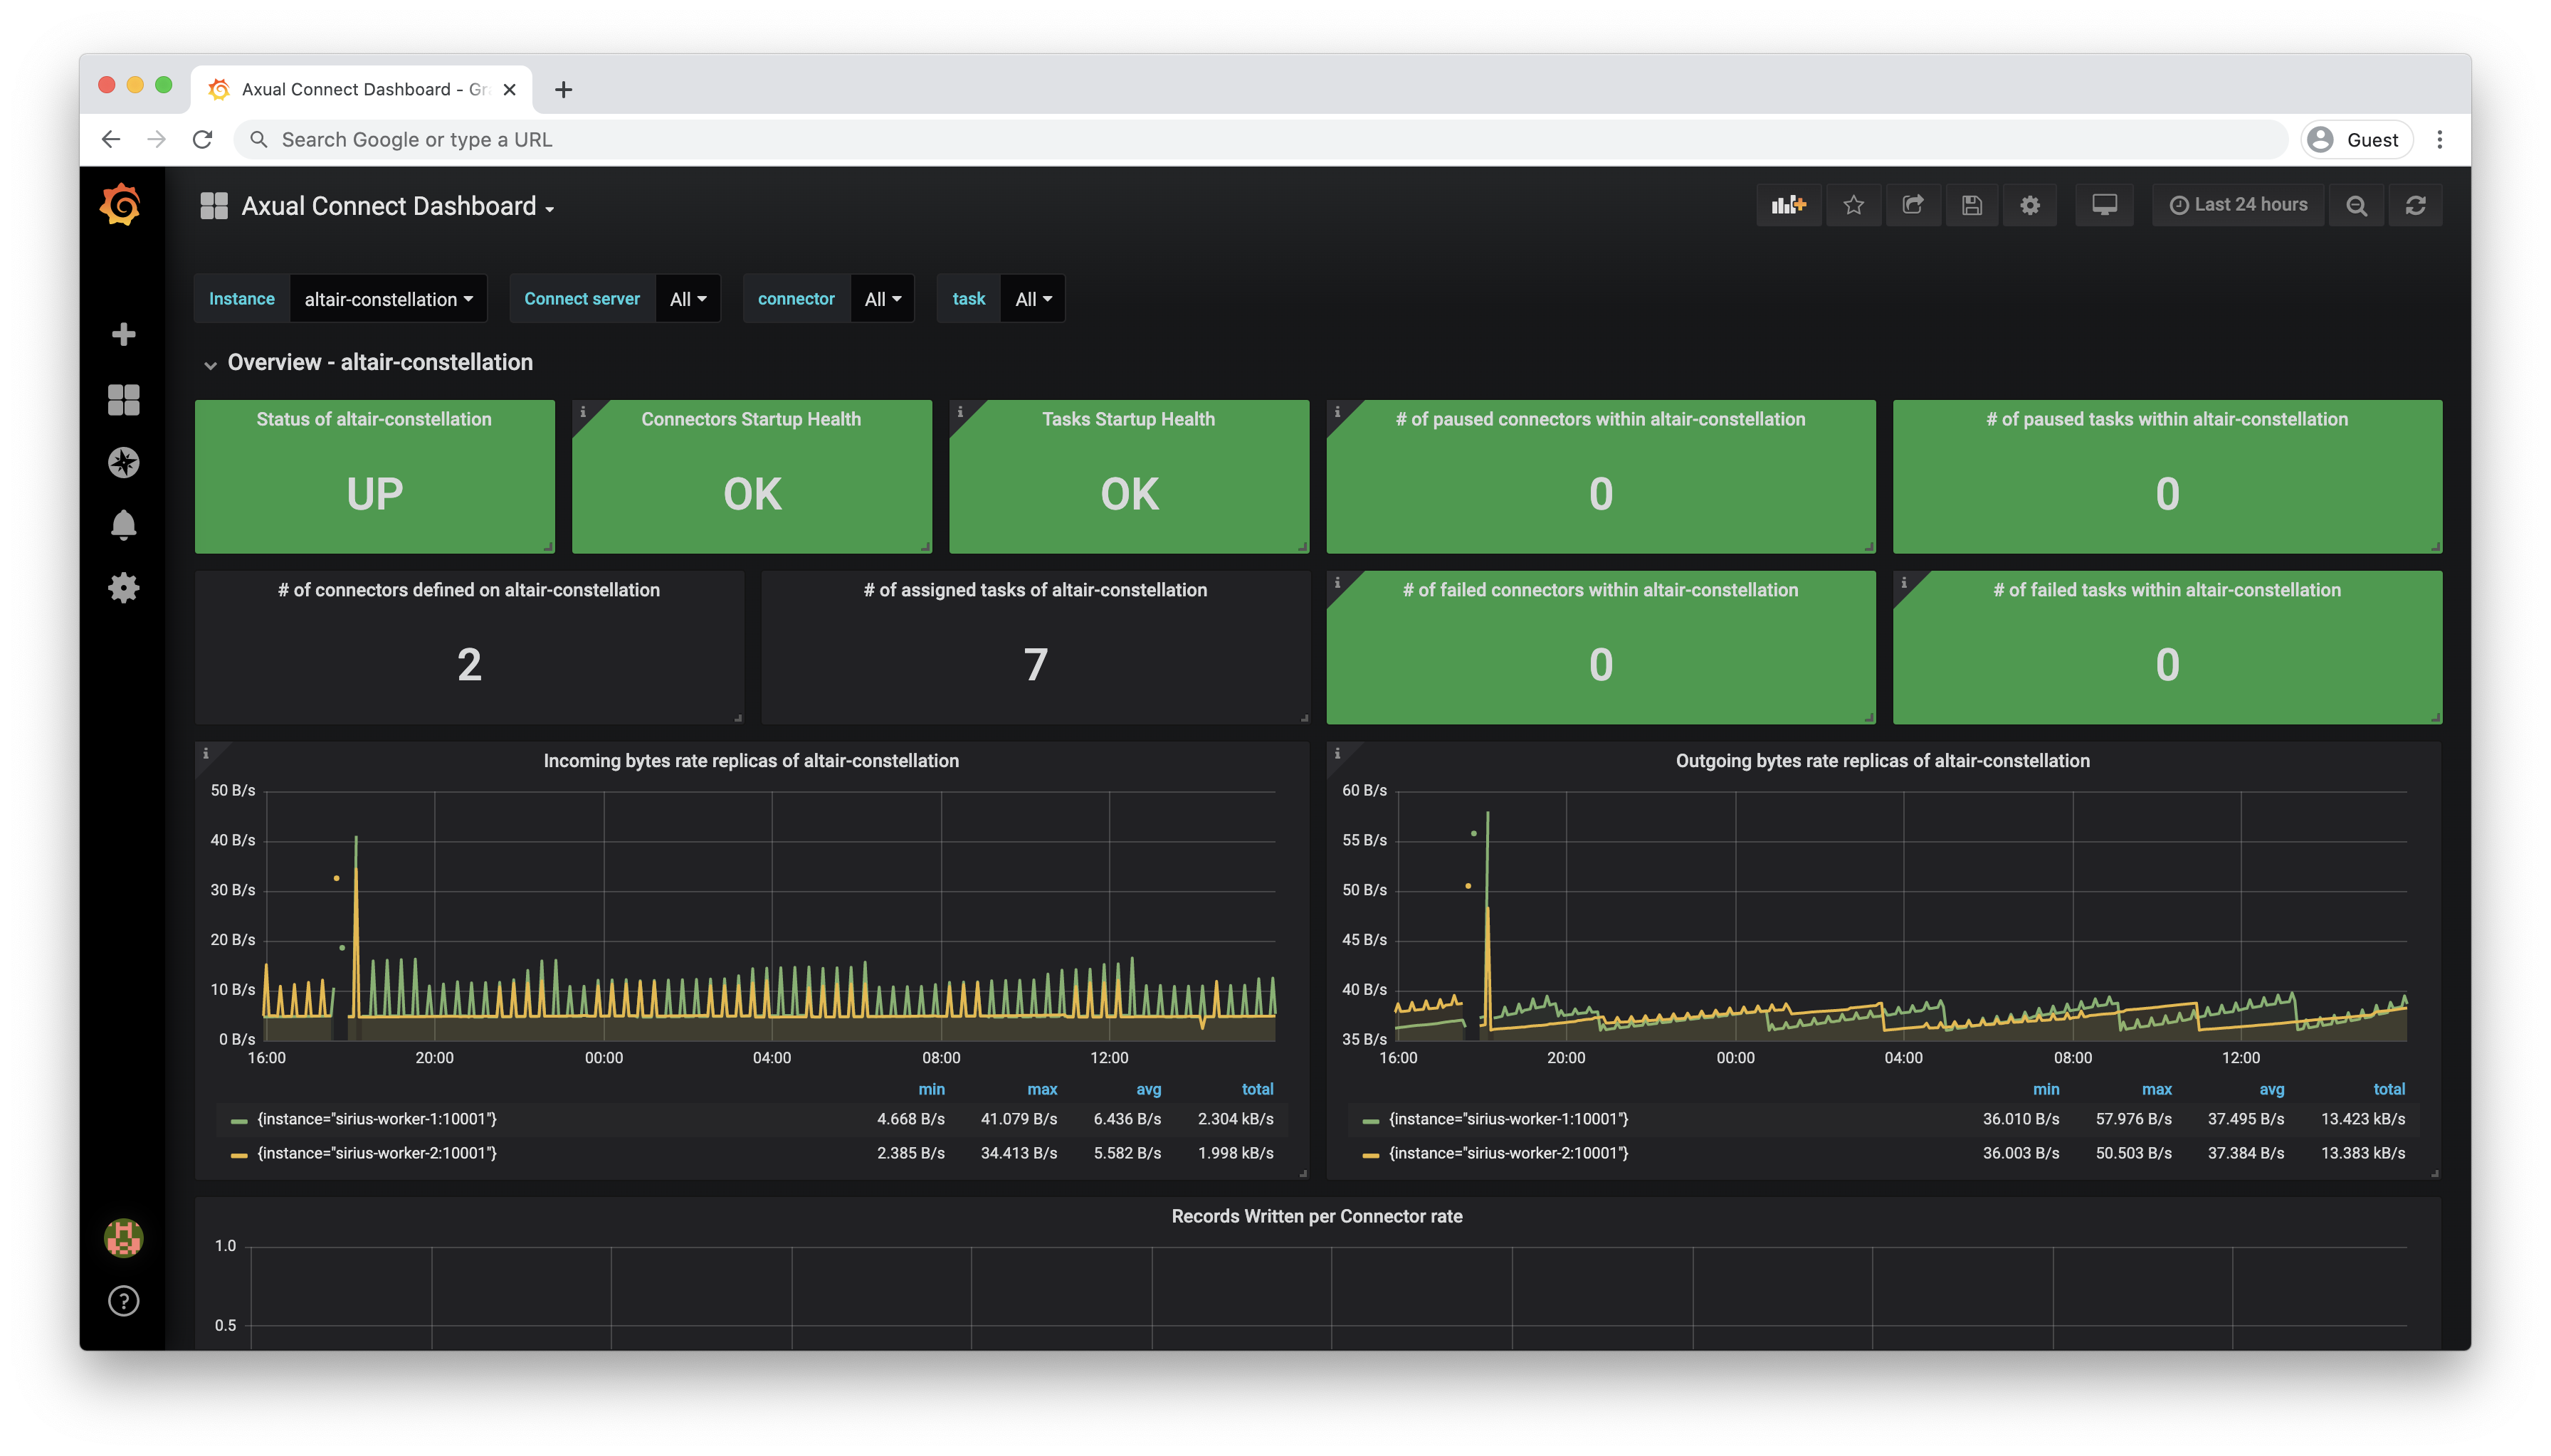
|
Dashboard provides a general overview of Connect service of a given instance |
|
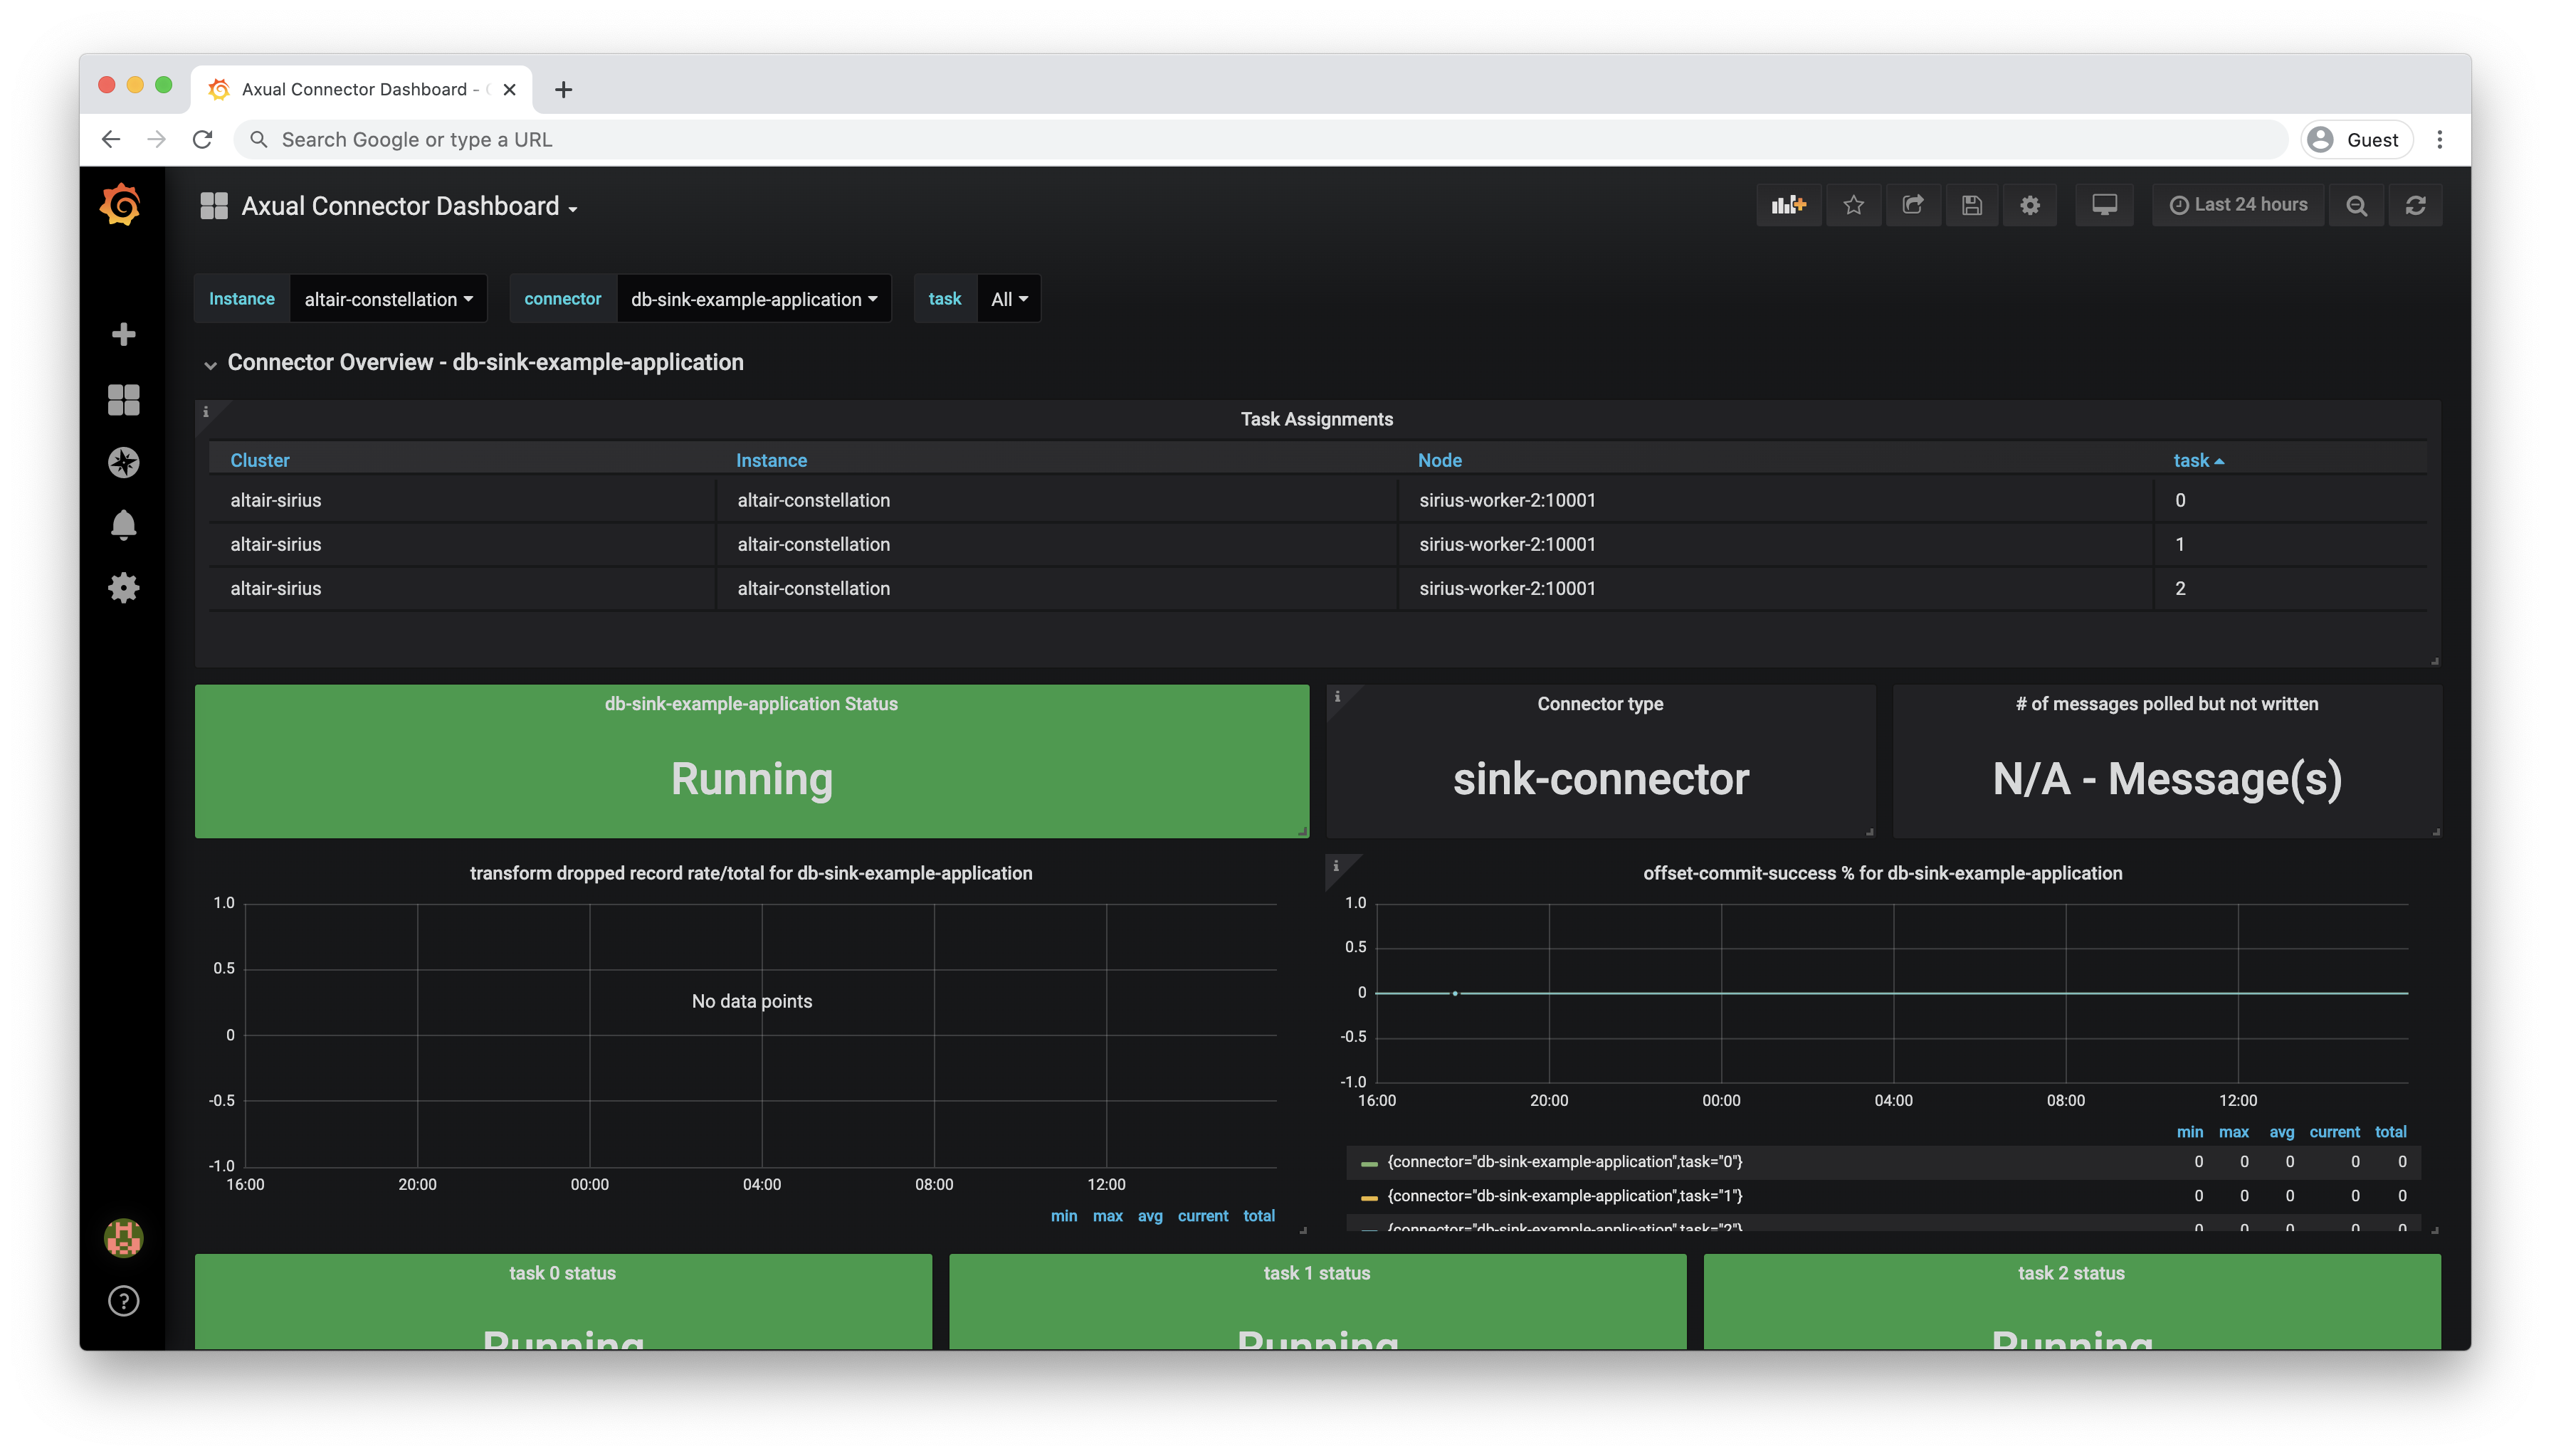
|
Dashboard which exposes metrics that concern individual connectors |
|
Rest-Proxy Detailed Overview |
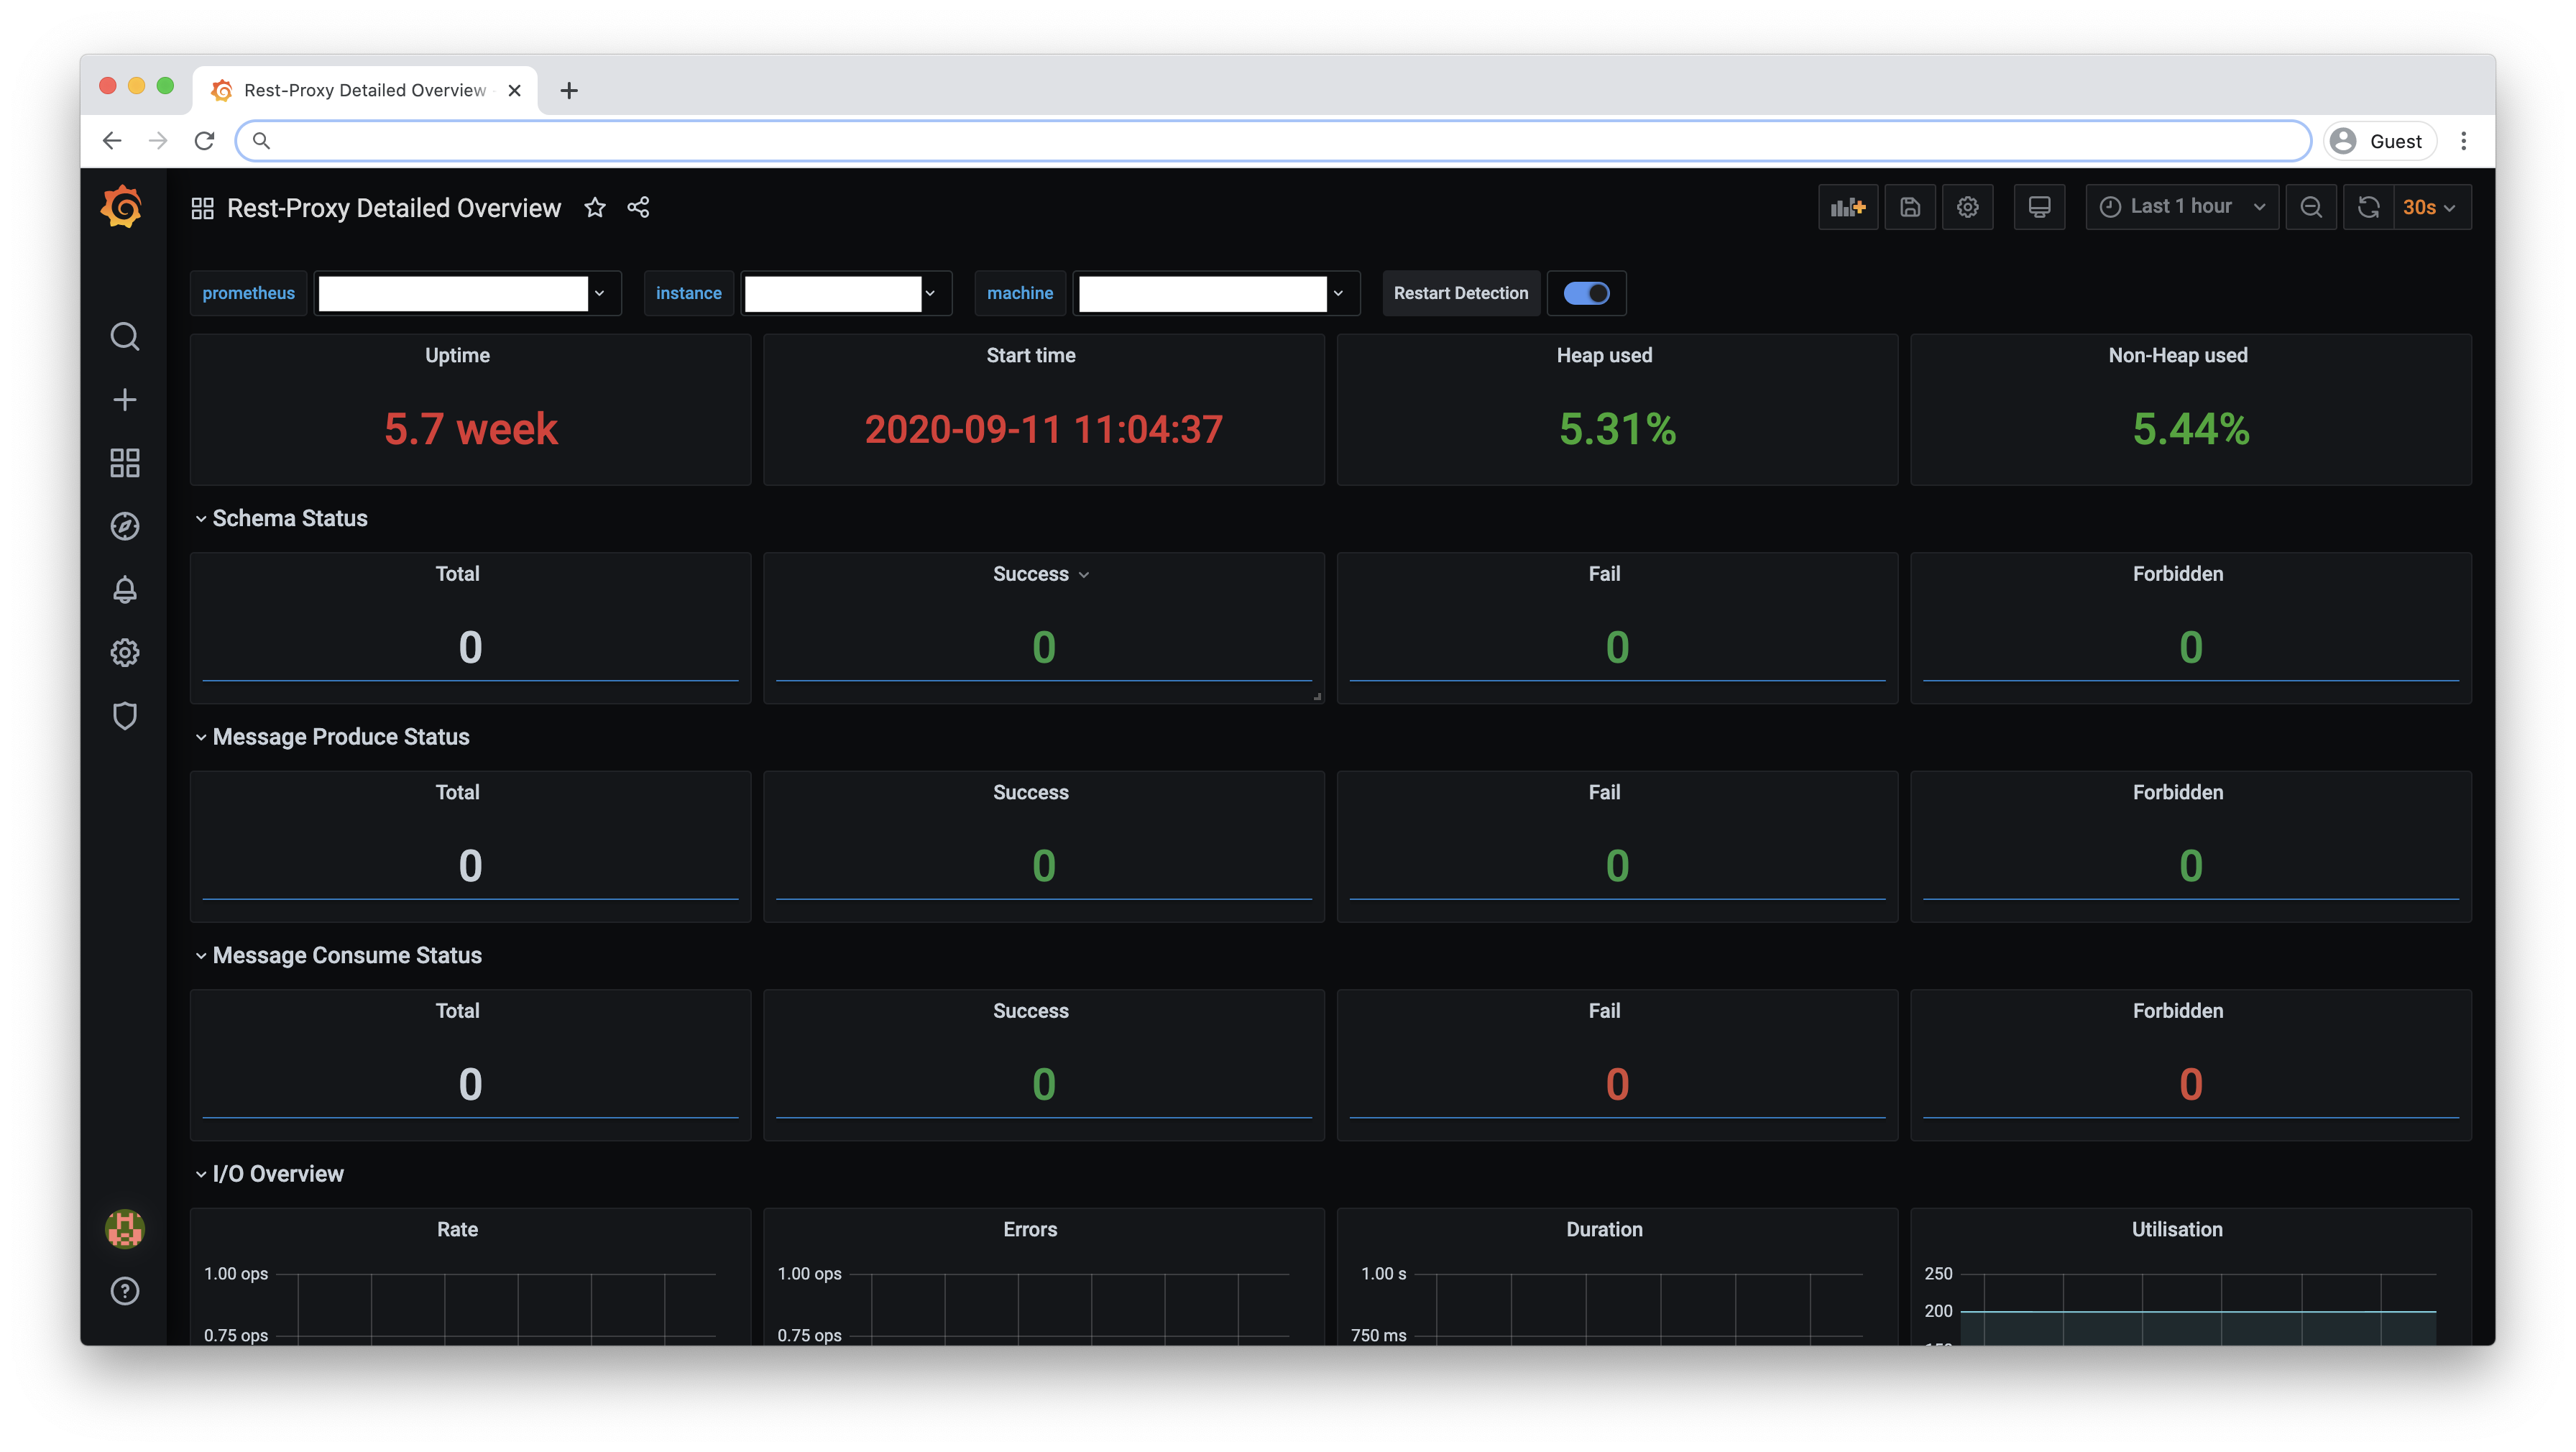
|
Dashboard which exposes metrics that concern to Rest-Proxy |
Cluster-API Detailed Overview |
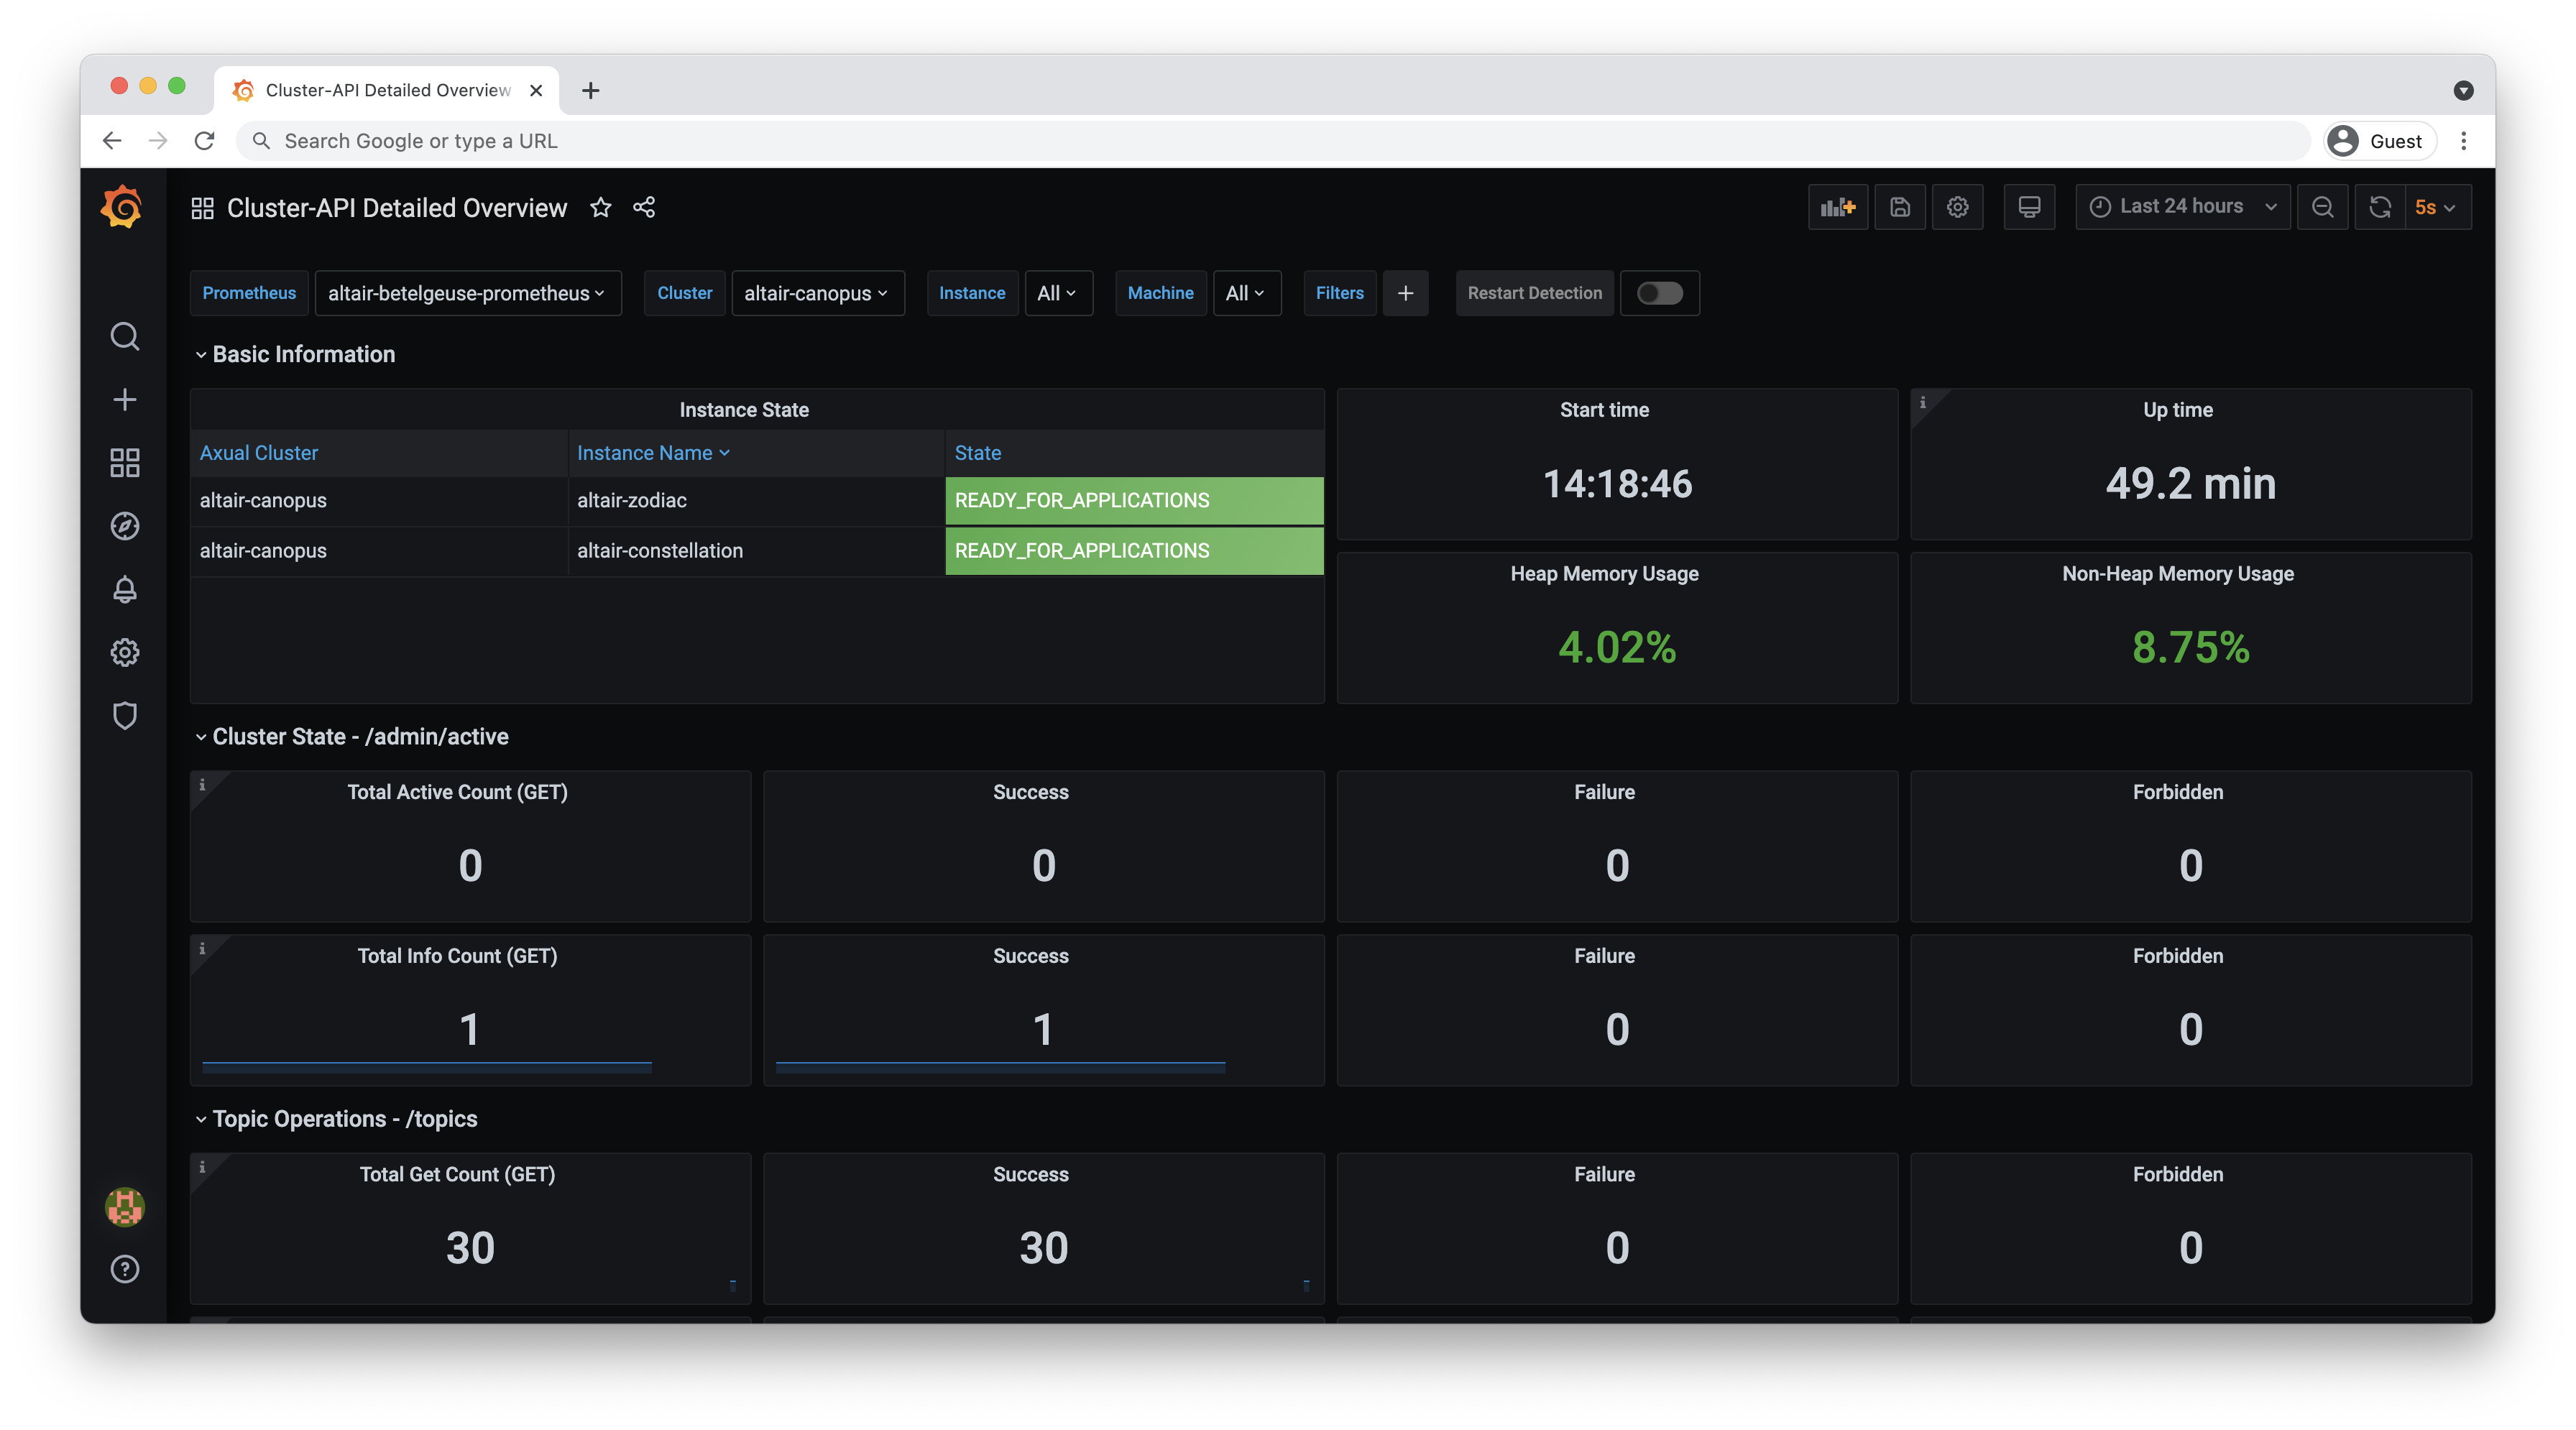
|
Dashboard which exposes metrics that concern to Cluster-API |
Message Delays |
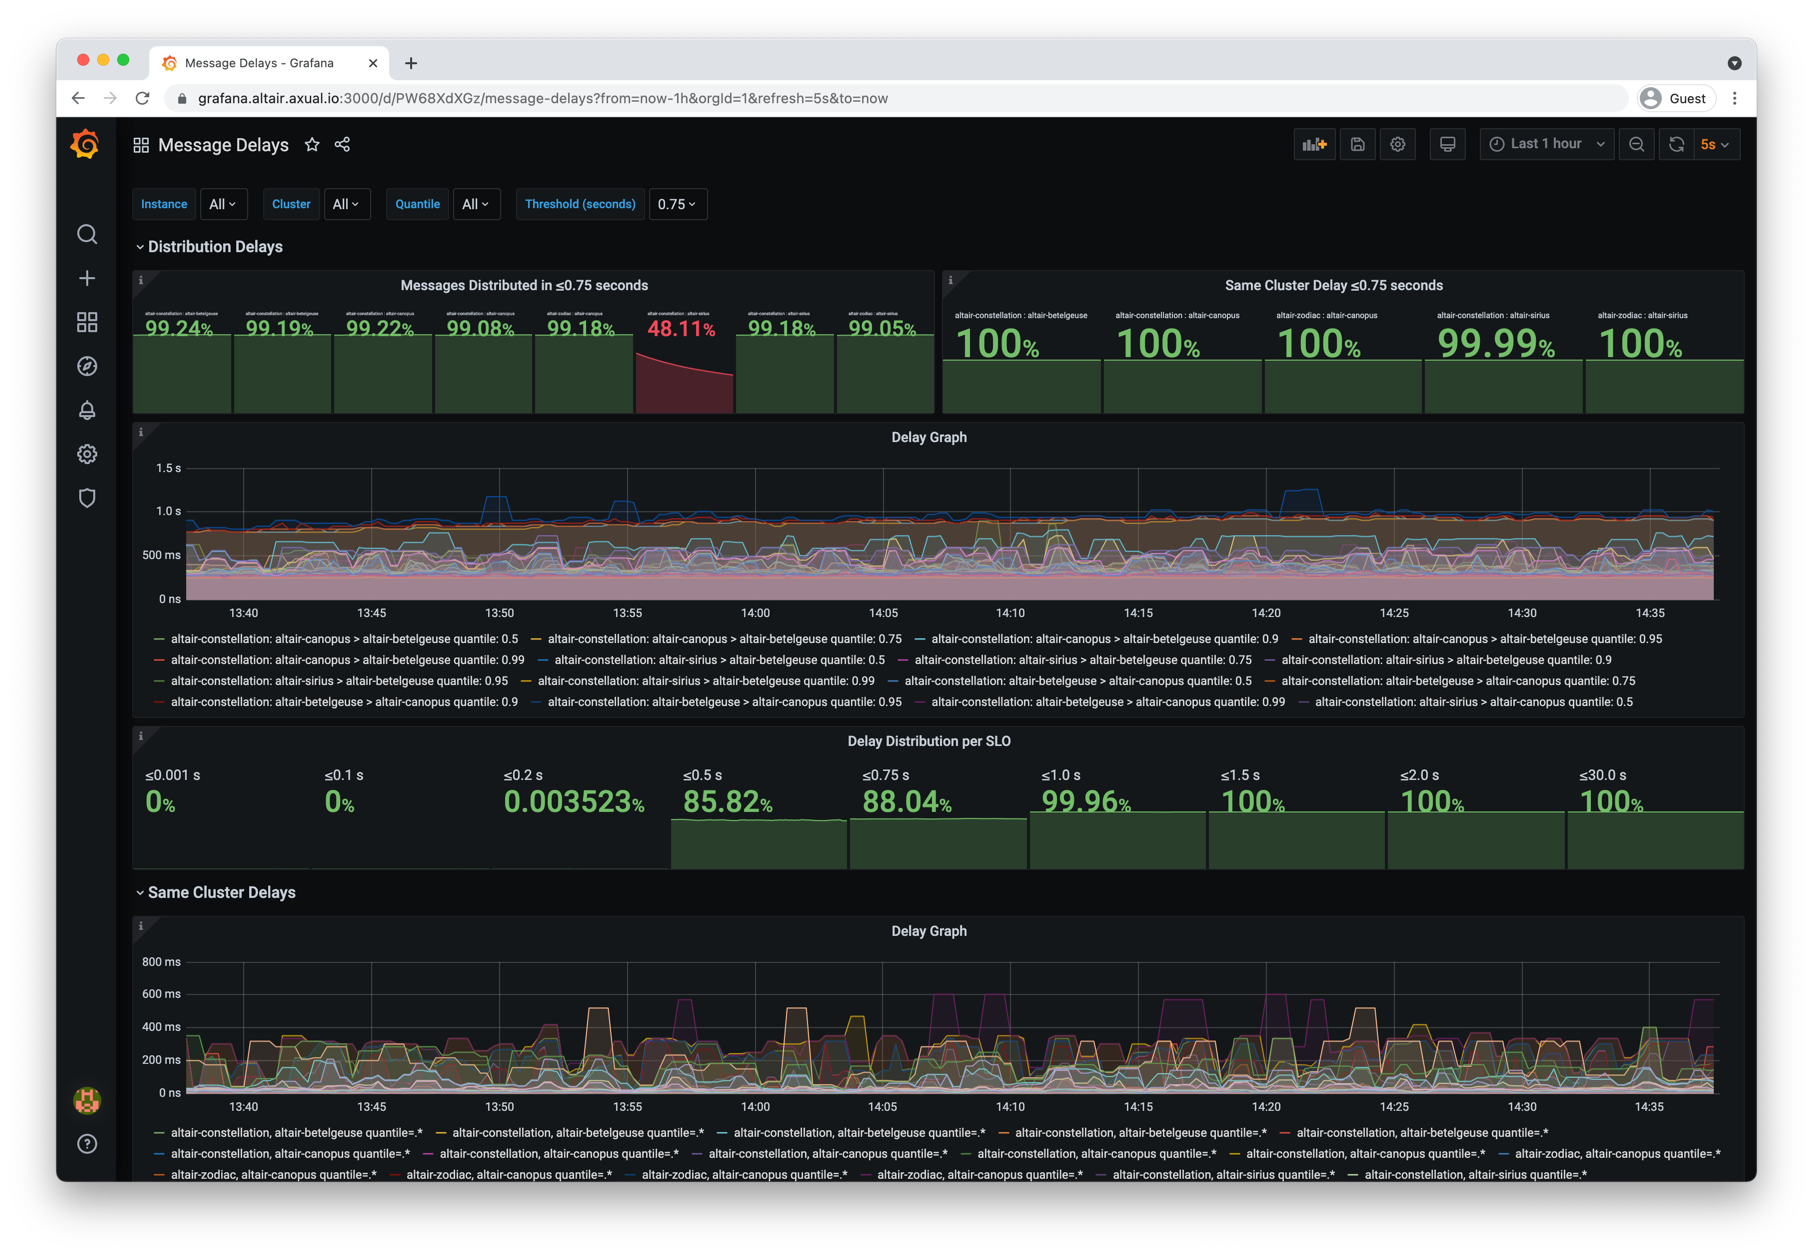
|
Shows the message end to end delays experienced inside an own cluster and after distribution |
When starting an new installation is advisable to monitor server metrics. The customer should monitor the time of operations and amount of operations performed. Are there times when an operation spikes in reference to resources used or time?
If there are spikes of bad performance then what causes the spikes? Try to correlate the spike with the amount of messages being send into the system and also CPU usages on the system. You should be able to answer the questions.
-
What is the normal system load?
-
Are there any (Cron) jobs running on the system. That slow the system at certain times.
-
Is there a level of CPU, Network Usage or Disk Usage that correlate to bad performance?
-
If the system load has increase then it there a need to add more brokers to handle the load?
-
Is there a need to add more Connect Instances or Rest Proxy instances to handle extra load?
-
Are the servers loaded evenly? Should you think about using a system such as Cruise Control to balance load?
-
What is a peak load that can be efficiently handled by the system.
Please do not only use Grafana to visually search for issues, but in times of good system performance, periodically create baseline statistics for your system. If there are ever performance issues you will not have a good idea of how to improve the system if you have not spent time in creating baseline statistics.