Viewing Logs with Elastic and Kibana
About the Elastic Stack
This page describes how production logs can be searched for troubleshooting production issues. We also show where alerts can be created for alerting possible problems appearing in log streams.
Instructions
The production infrastructure uses the EFK (ElasticSearch, Fluentd & Kibana) stack to generate a logging repository. This repository can be searched, and alerts can be created from an incoming log stream.
Viewing Logs
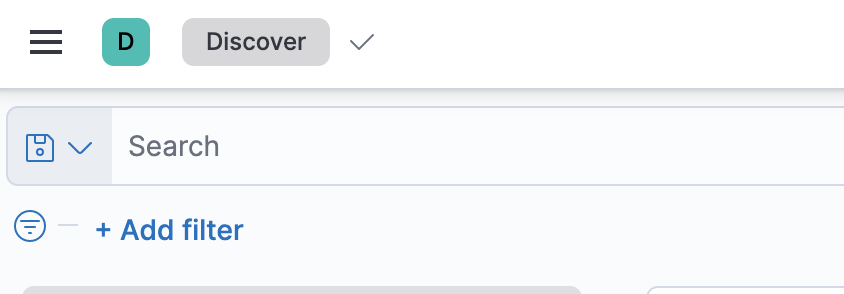
A screen will open where all logs can be viewed. Inside this screen, you will need to select the Elastic Search Index for the logs that you want to view. The index can be selected from the drop-down at the left of the screen:
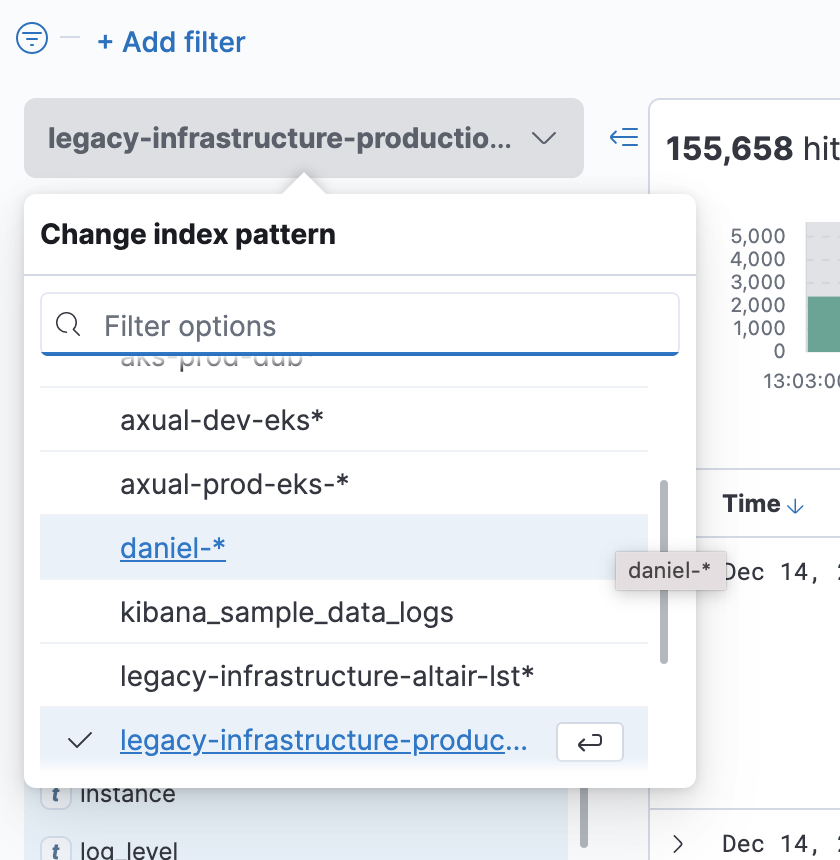
Please contact your administration team details on the logs index names available.
Once you have found the correct index, create filters to search for log messages.
-
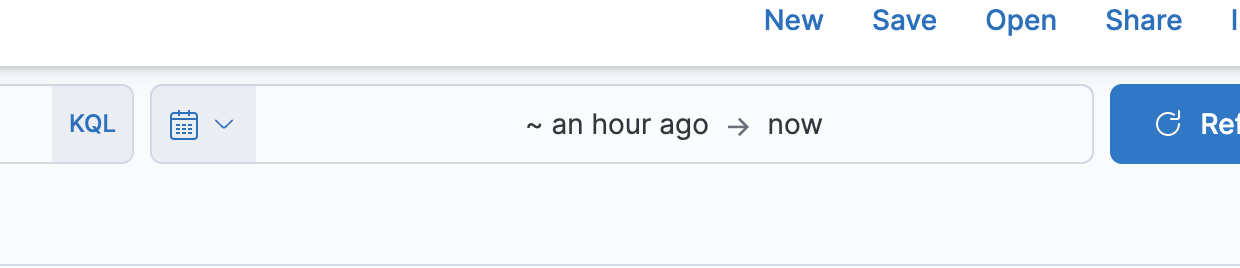
At the top of the window, click inside the time filter to show messages for a certain time range. Generally, you will look at the last half hour to an hour of activity. But if a user reports an issue at a certain time, then you would search at five minutes around that time.
-
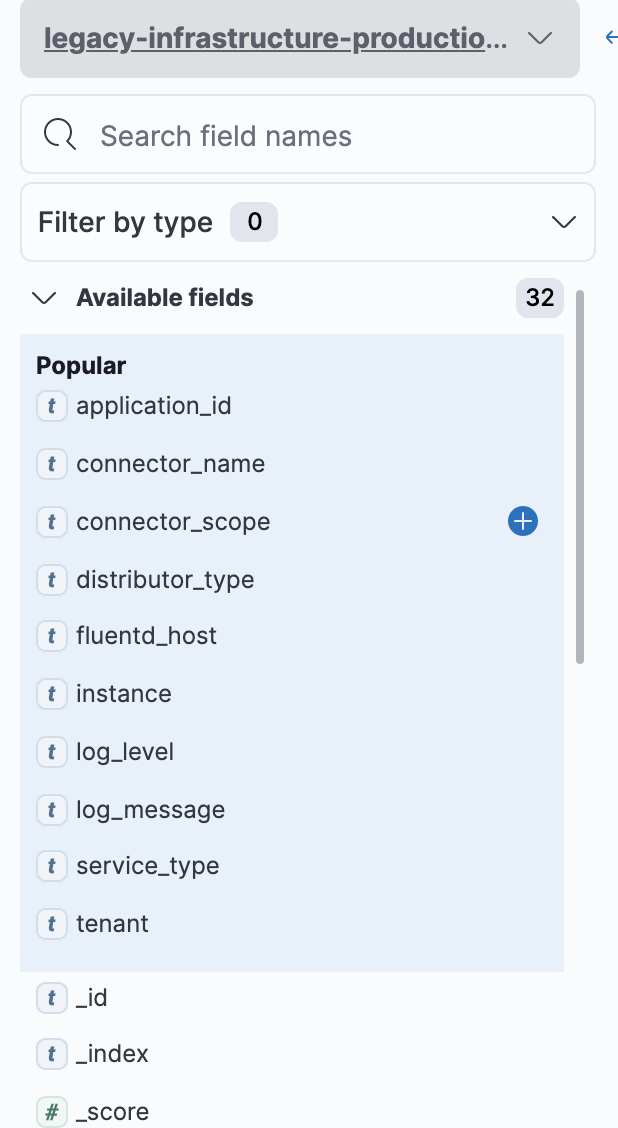
On the right side of the screen, click a field to add a filter on that field. A popup will list unique values for the field in the last 500 messages. Choose one of the values to filter all messages on that value.
-
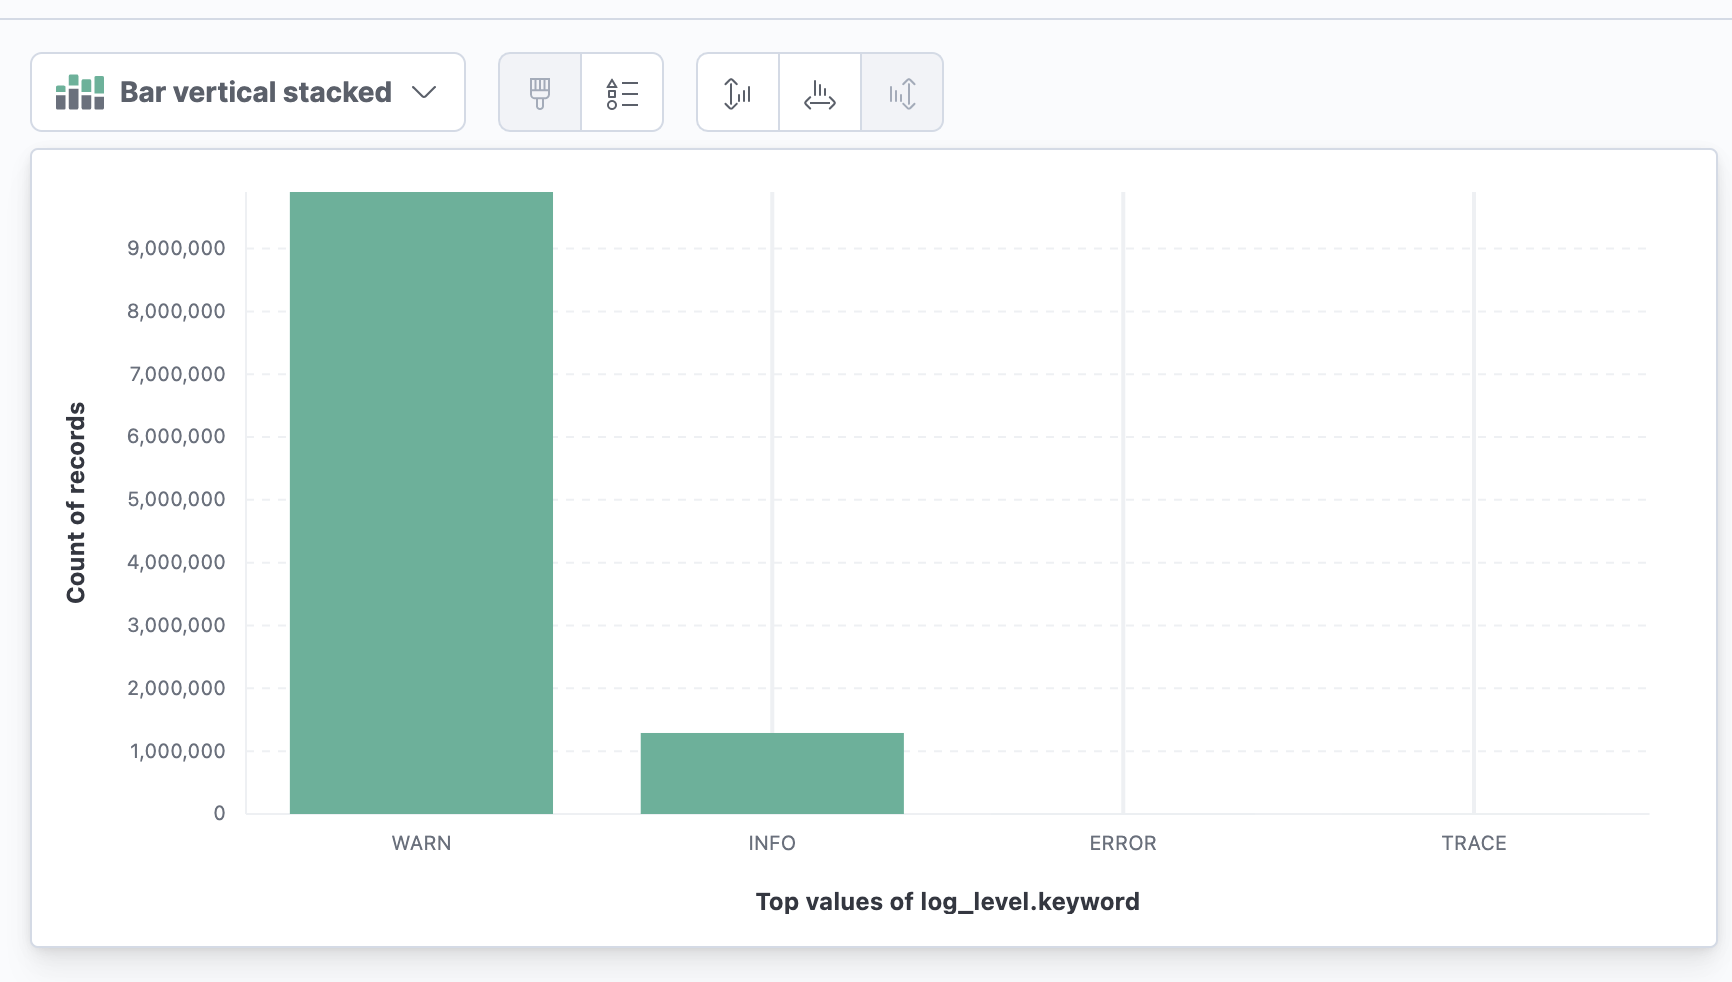
Sometimes, you want to filter on a value that does not appear in the past 500 messages, to view all values for that field inside of a time range, click the field and then Visualize. In the next screen all distinct values for that field are listed.
-
To create an ad-hoc filter, click inside of the search input and type the filter ( Use a colon : for equals)
Commonly used filters are:
log_level: DEBUG, ERROR, INFO, TRACE, WARN
service_type: the name of the Axual service. (broker, connect,..)
container-name: The name of the Kubernetes container.
tennant: The tenant causing the error.
remote_host: The host from which the connection is made.
To enhance your searches inside the Discover tab, the Kibana query language is a powerful way to get the information you need. Check out the documentation and remember to use AND and OR capitalized.
Alerting
It is possible to be alerted if logging occurs matching a filter. (For example, if log_level : ERROR and log_message : ‘This is very bad.’)
-
Click the gear icon from the left toolbar: Management.
-
From the Elasticsearch list, click on Watcher.
-
From Watcher page:
-
Click the Create button
-
Choose Create threshold alert
-
From Create threshold alert page: Enter the Name of the alert.
-
Select the index in the Indices to query field.
-
Select timestamp in the Time field area.
-
Define the time threshold in the, 'Run watch every fields'
-
Use the embedded query generator to generate a Matching Condition
-
-
Send the alert: Open Kibana and then:
-
Click the Add Actions button
-
Choose Slack or Email.
-