Dashboards
Available monitoring dashboards
Grafana dashboards are automatically provisioned when starting Axual. The following dashboards are available to monitor the platform:
Dashboard name |
Screenshot |
Contents |
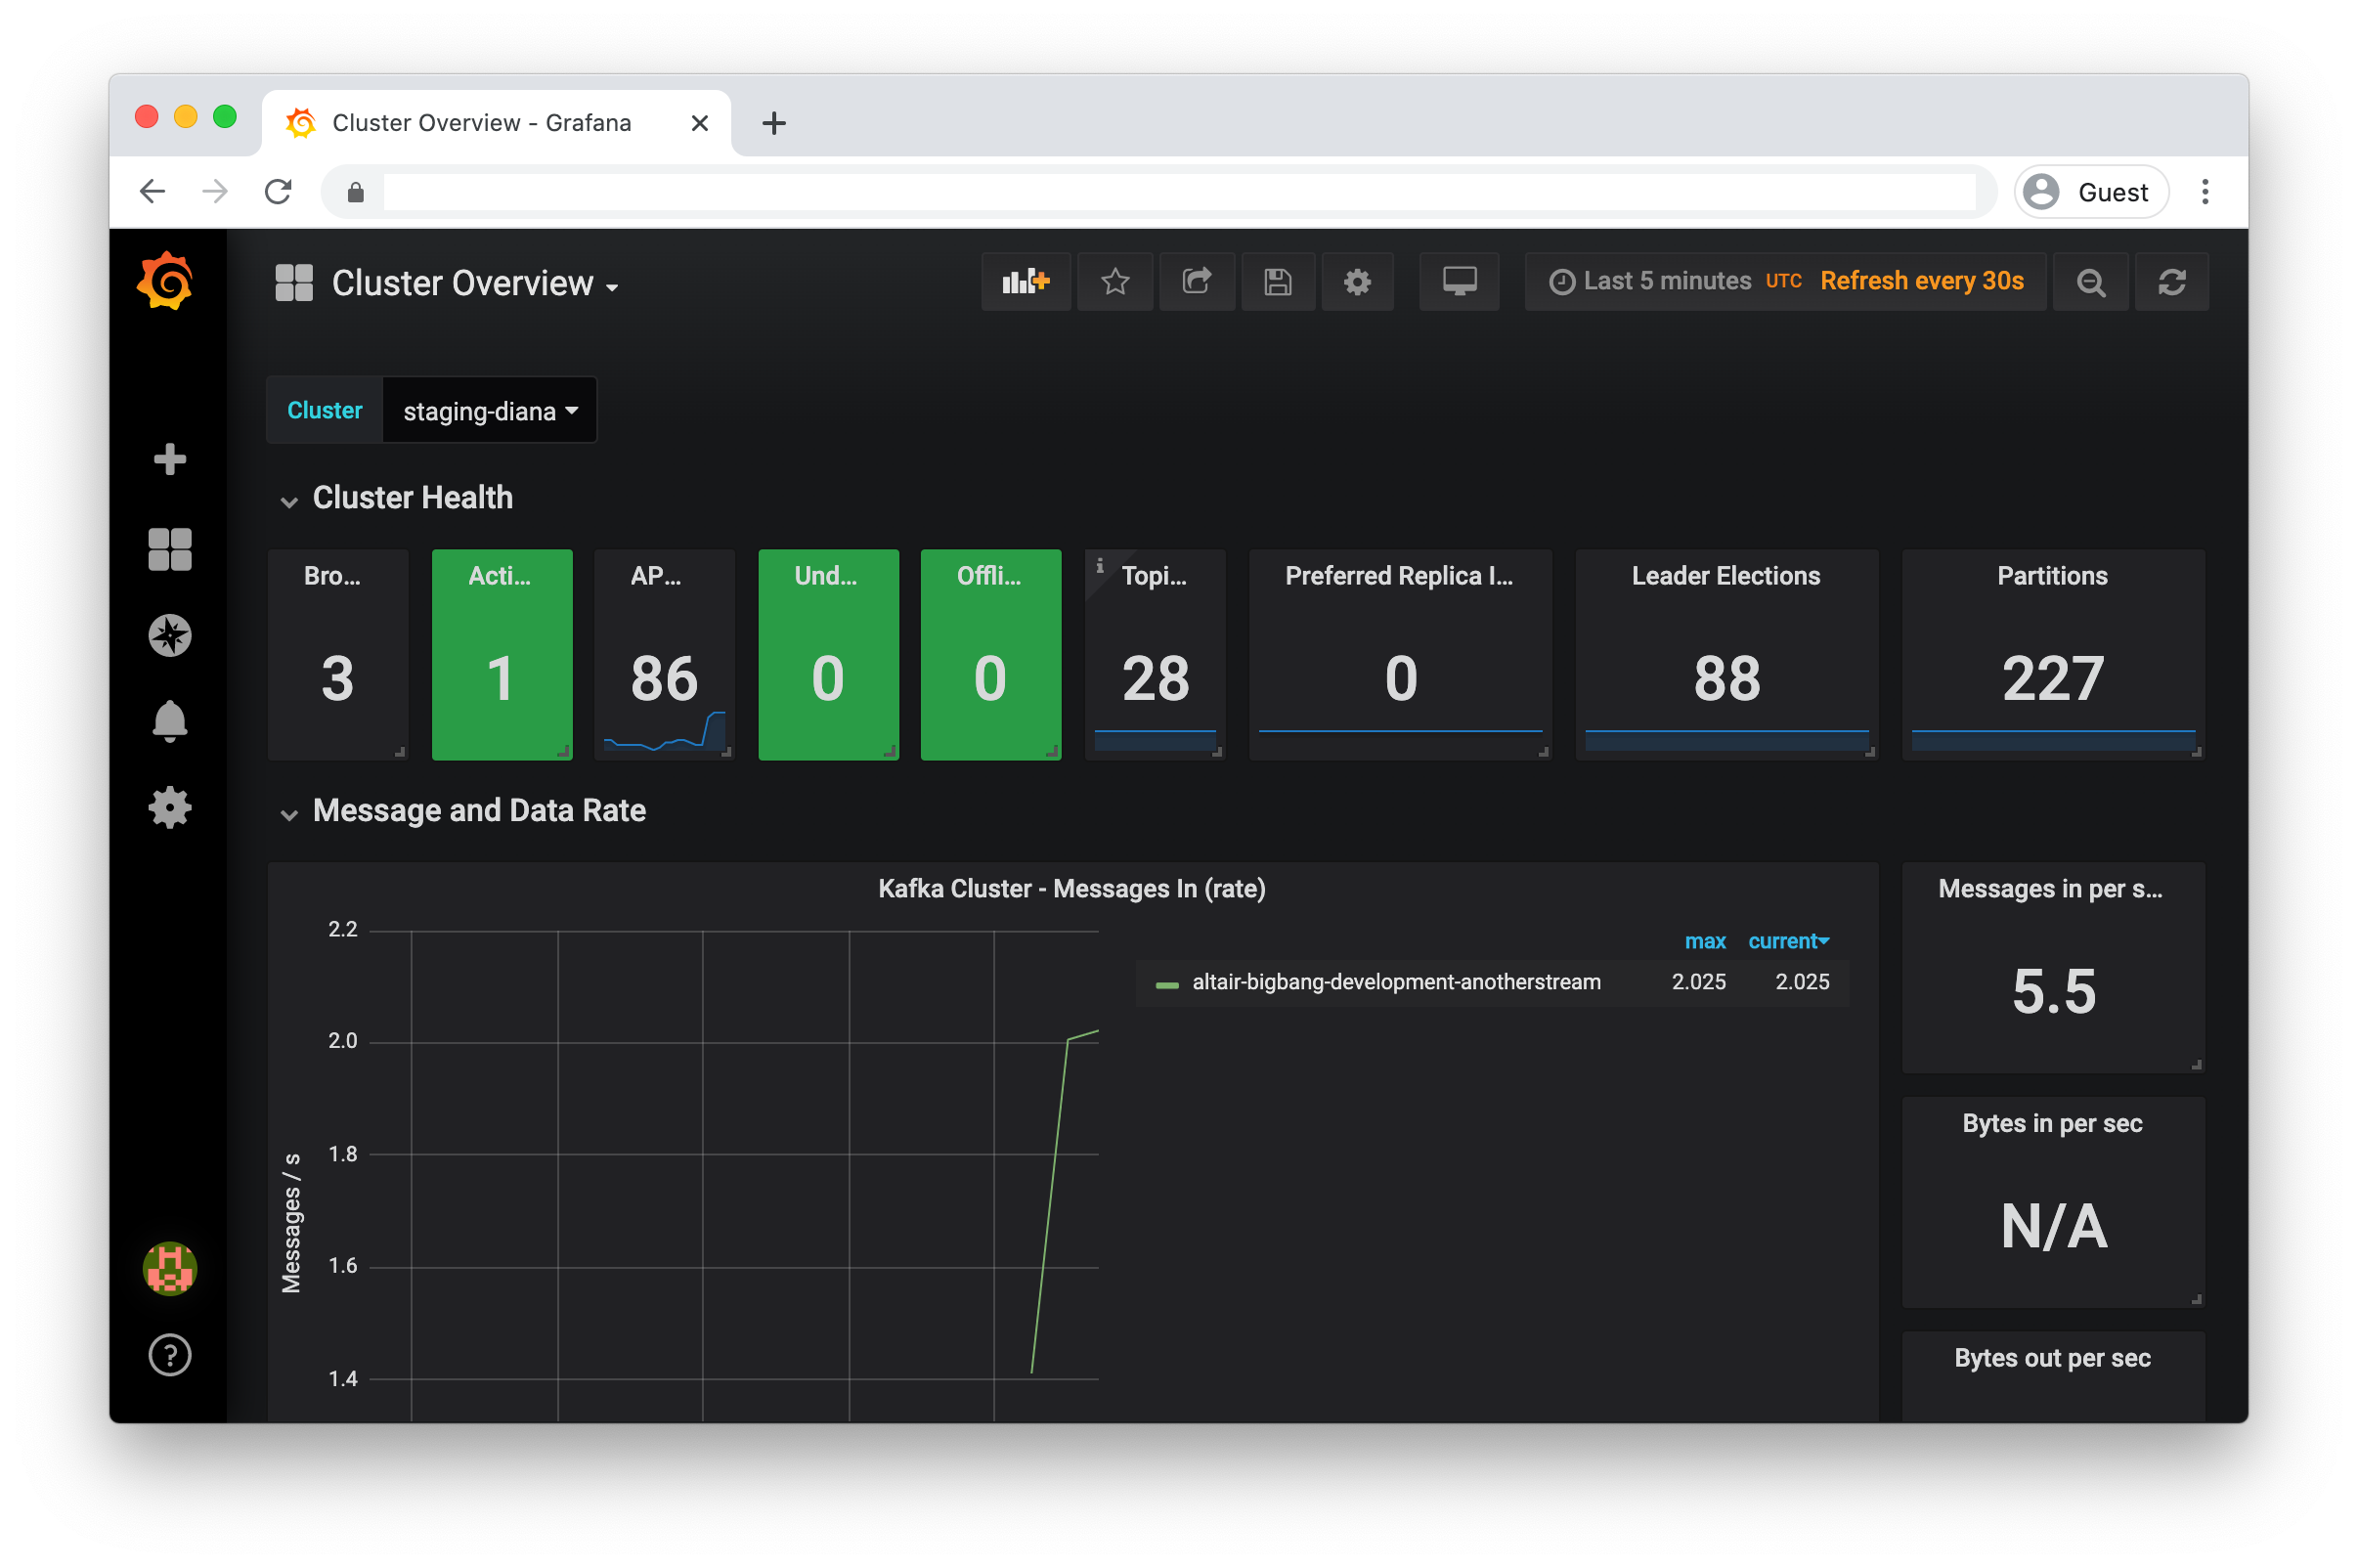
Cluster Overview |
|
A high level dashboard showing the cluster status and metrics |
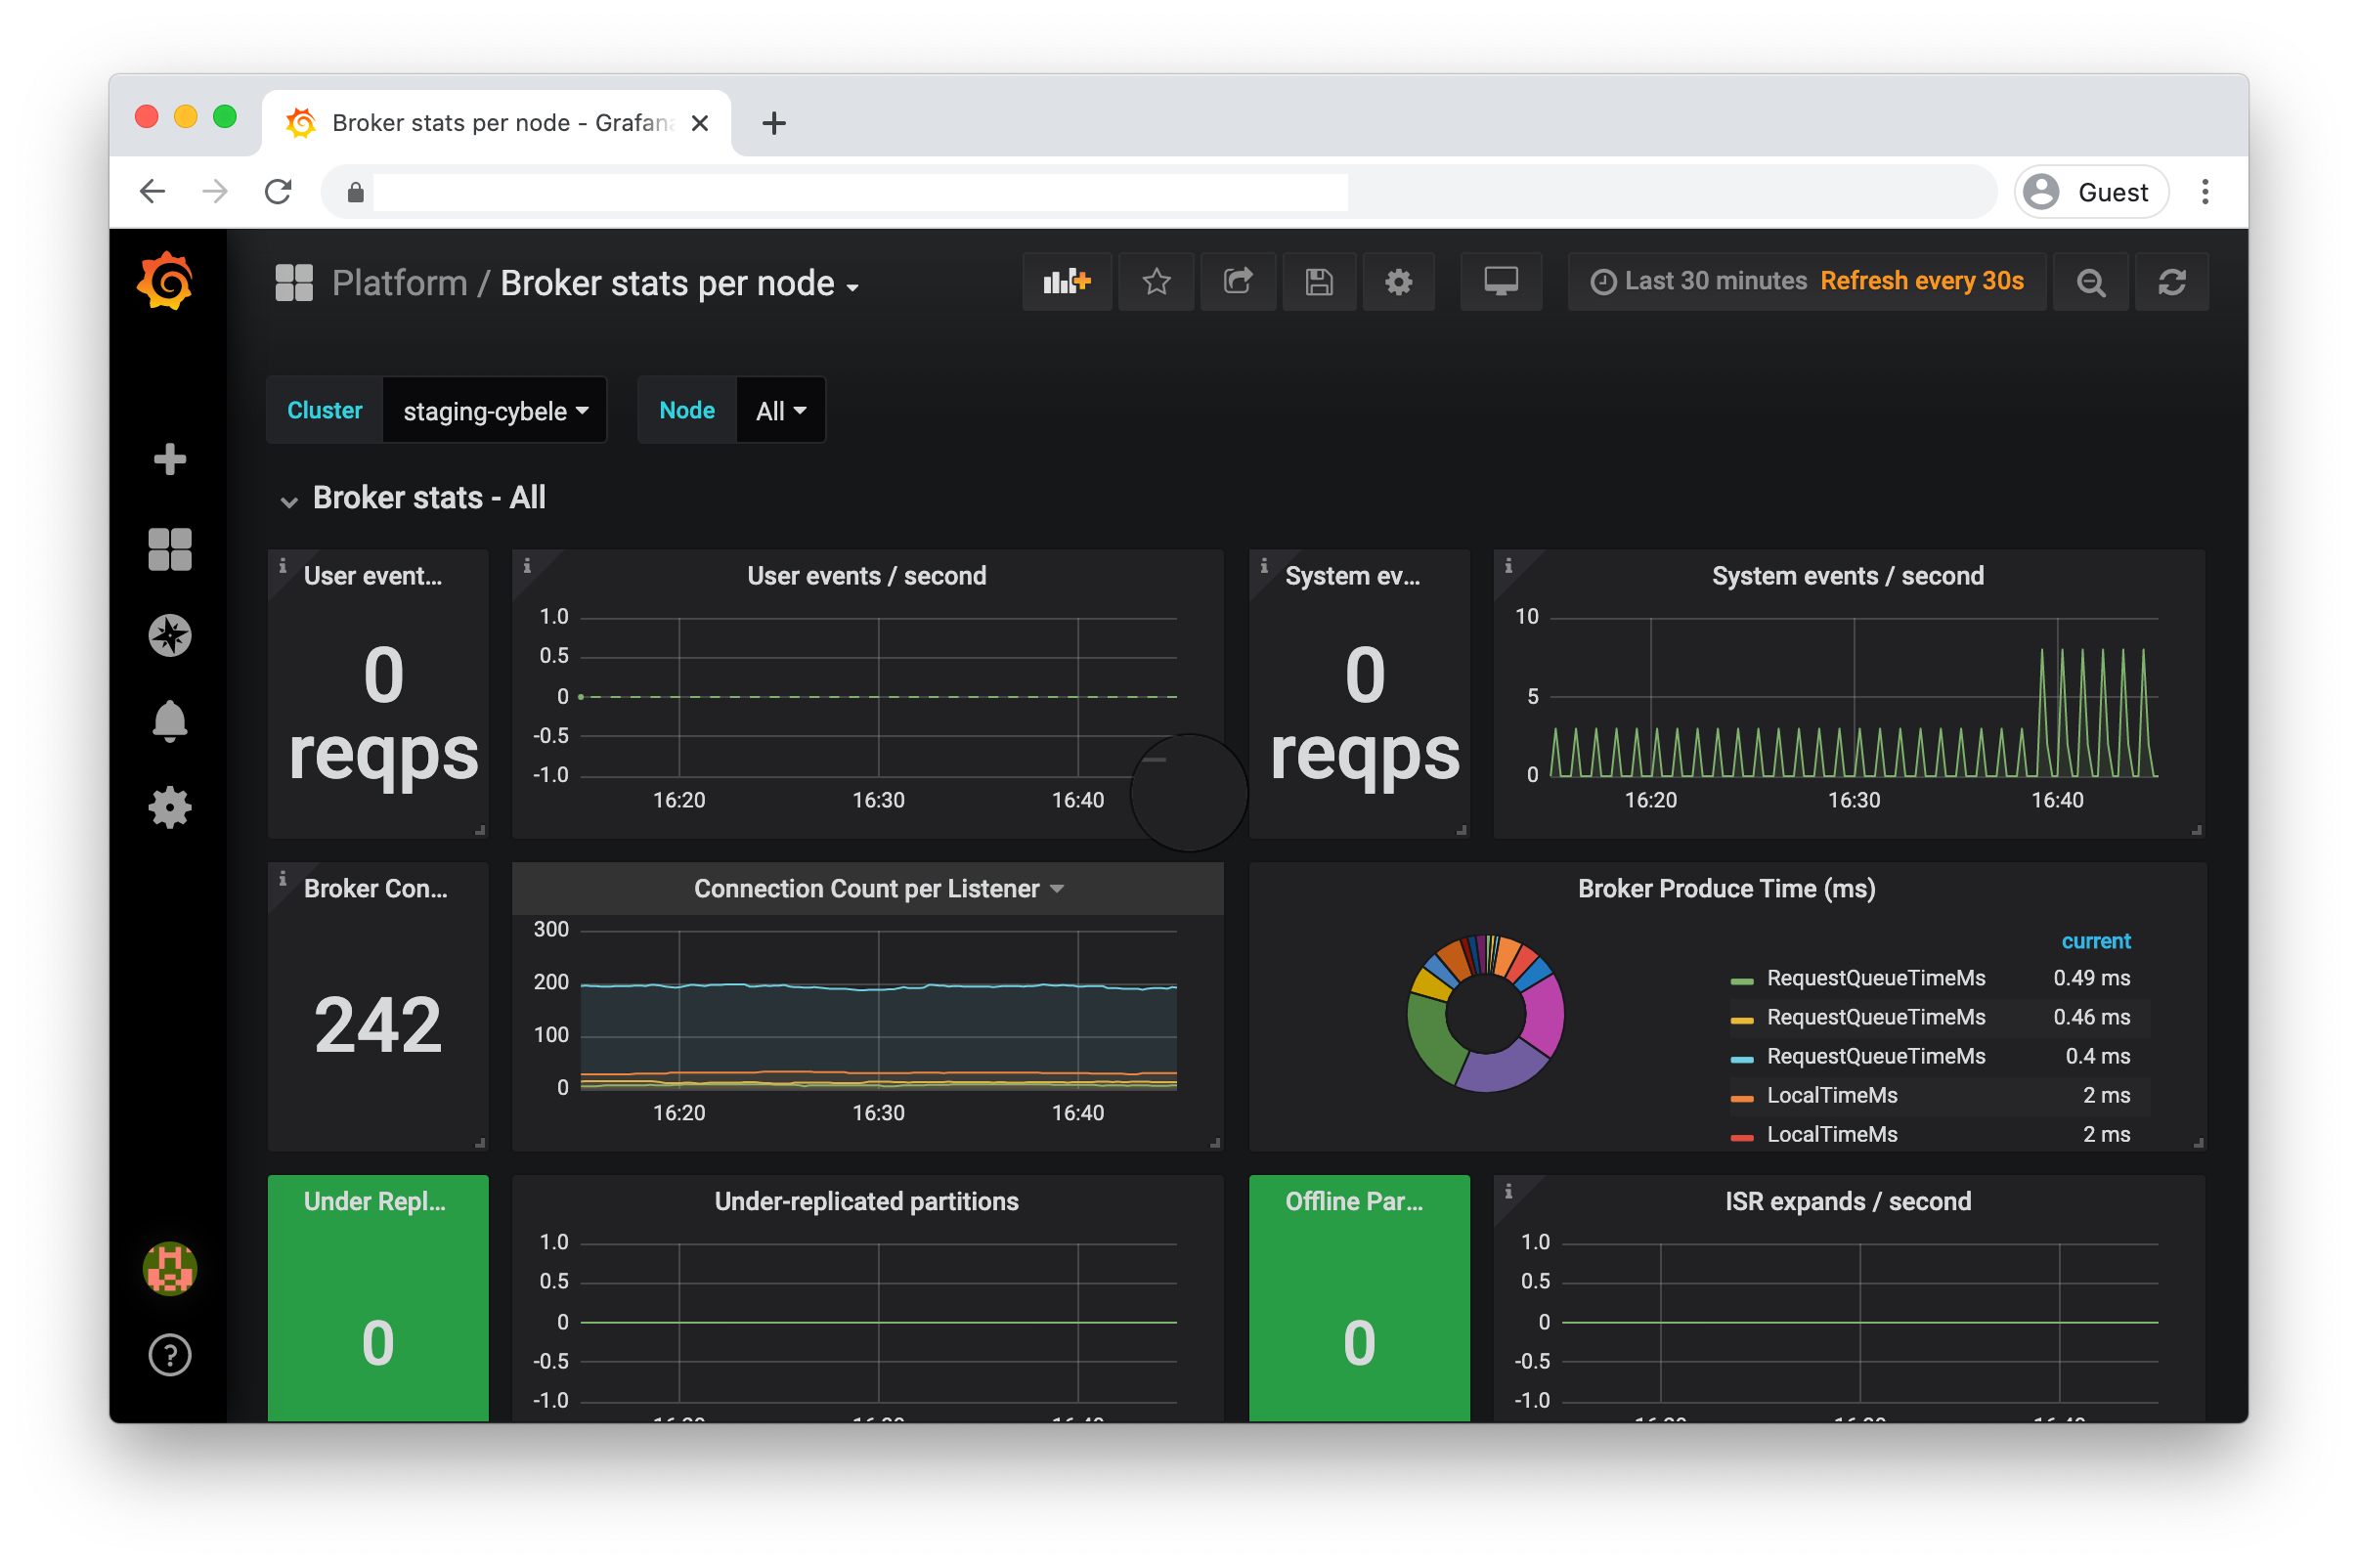
Broker stats per node |
|
A dashboard useful to zoom in to the metrics for a single broker node |
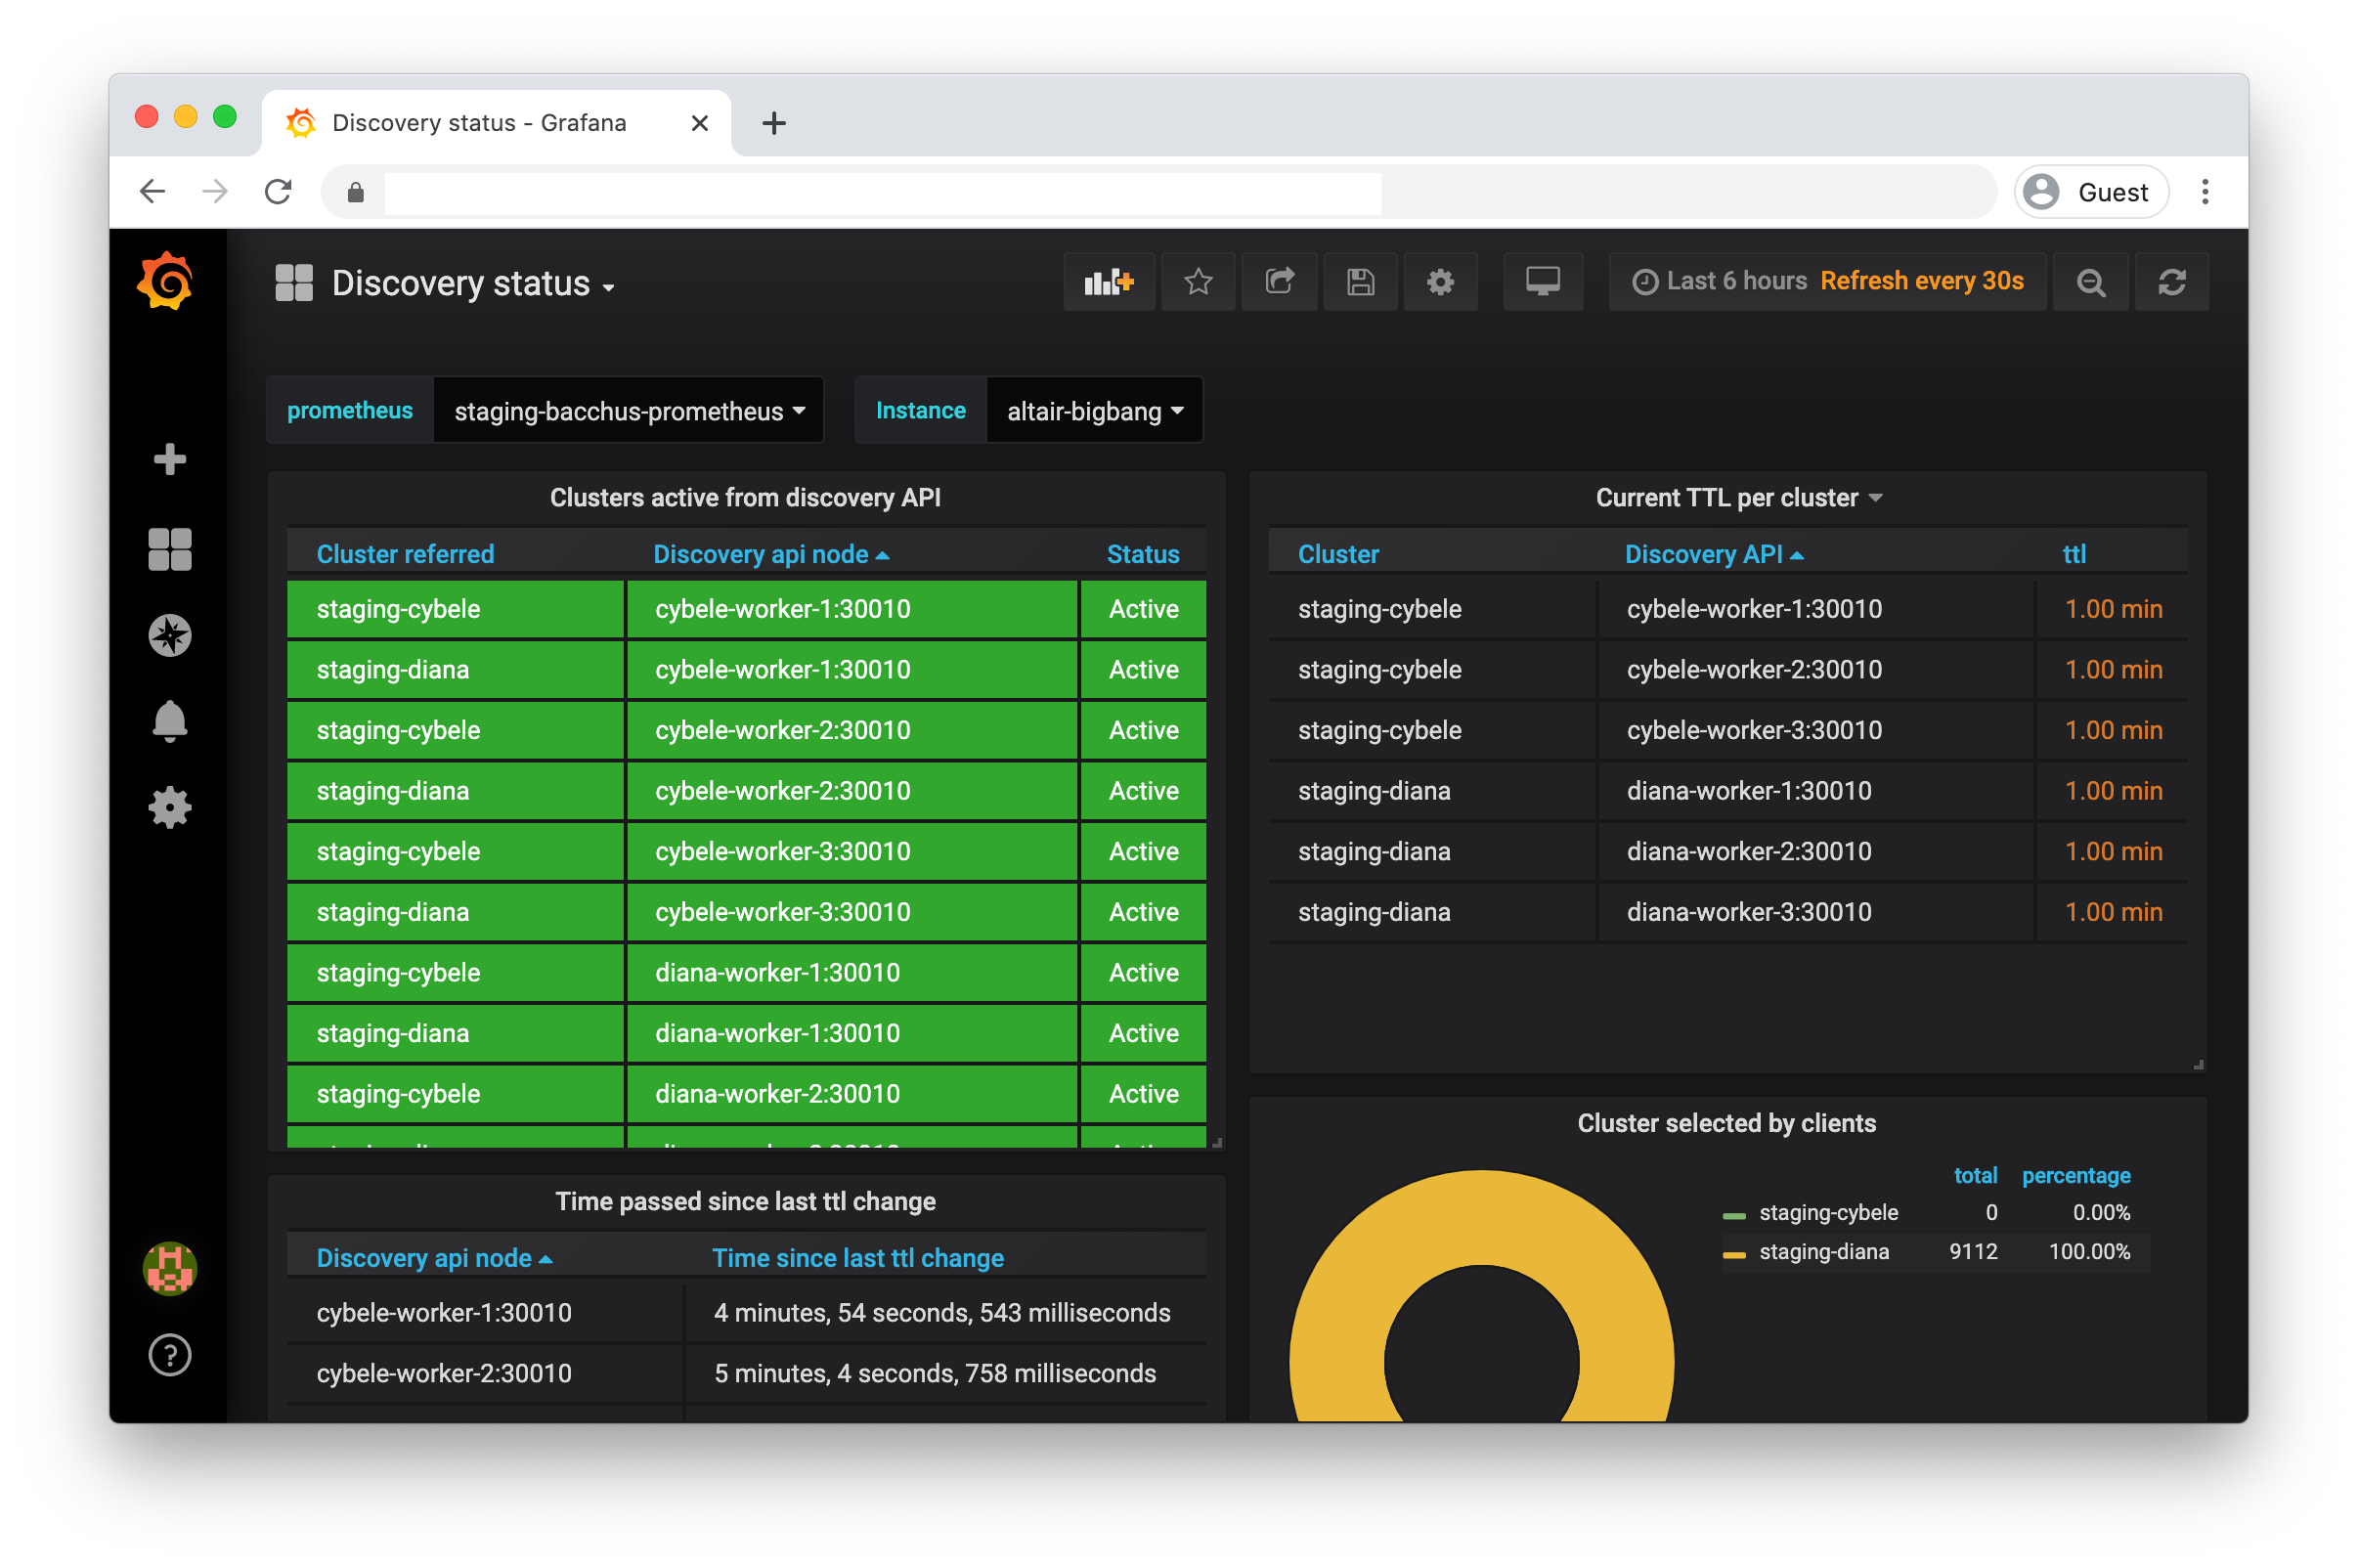
Discovery status |
|
A dashboard showing the (instance specific) status of the Discovery API and other metrics |
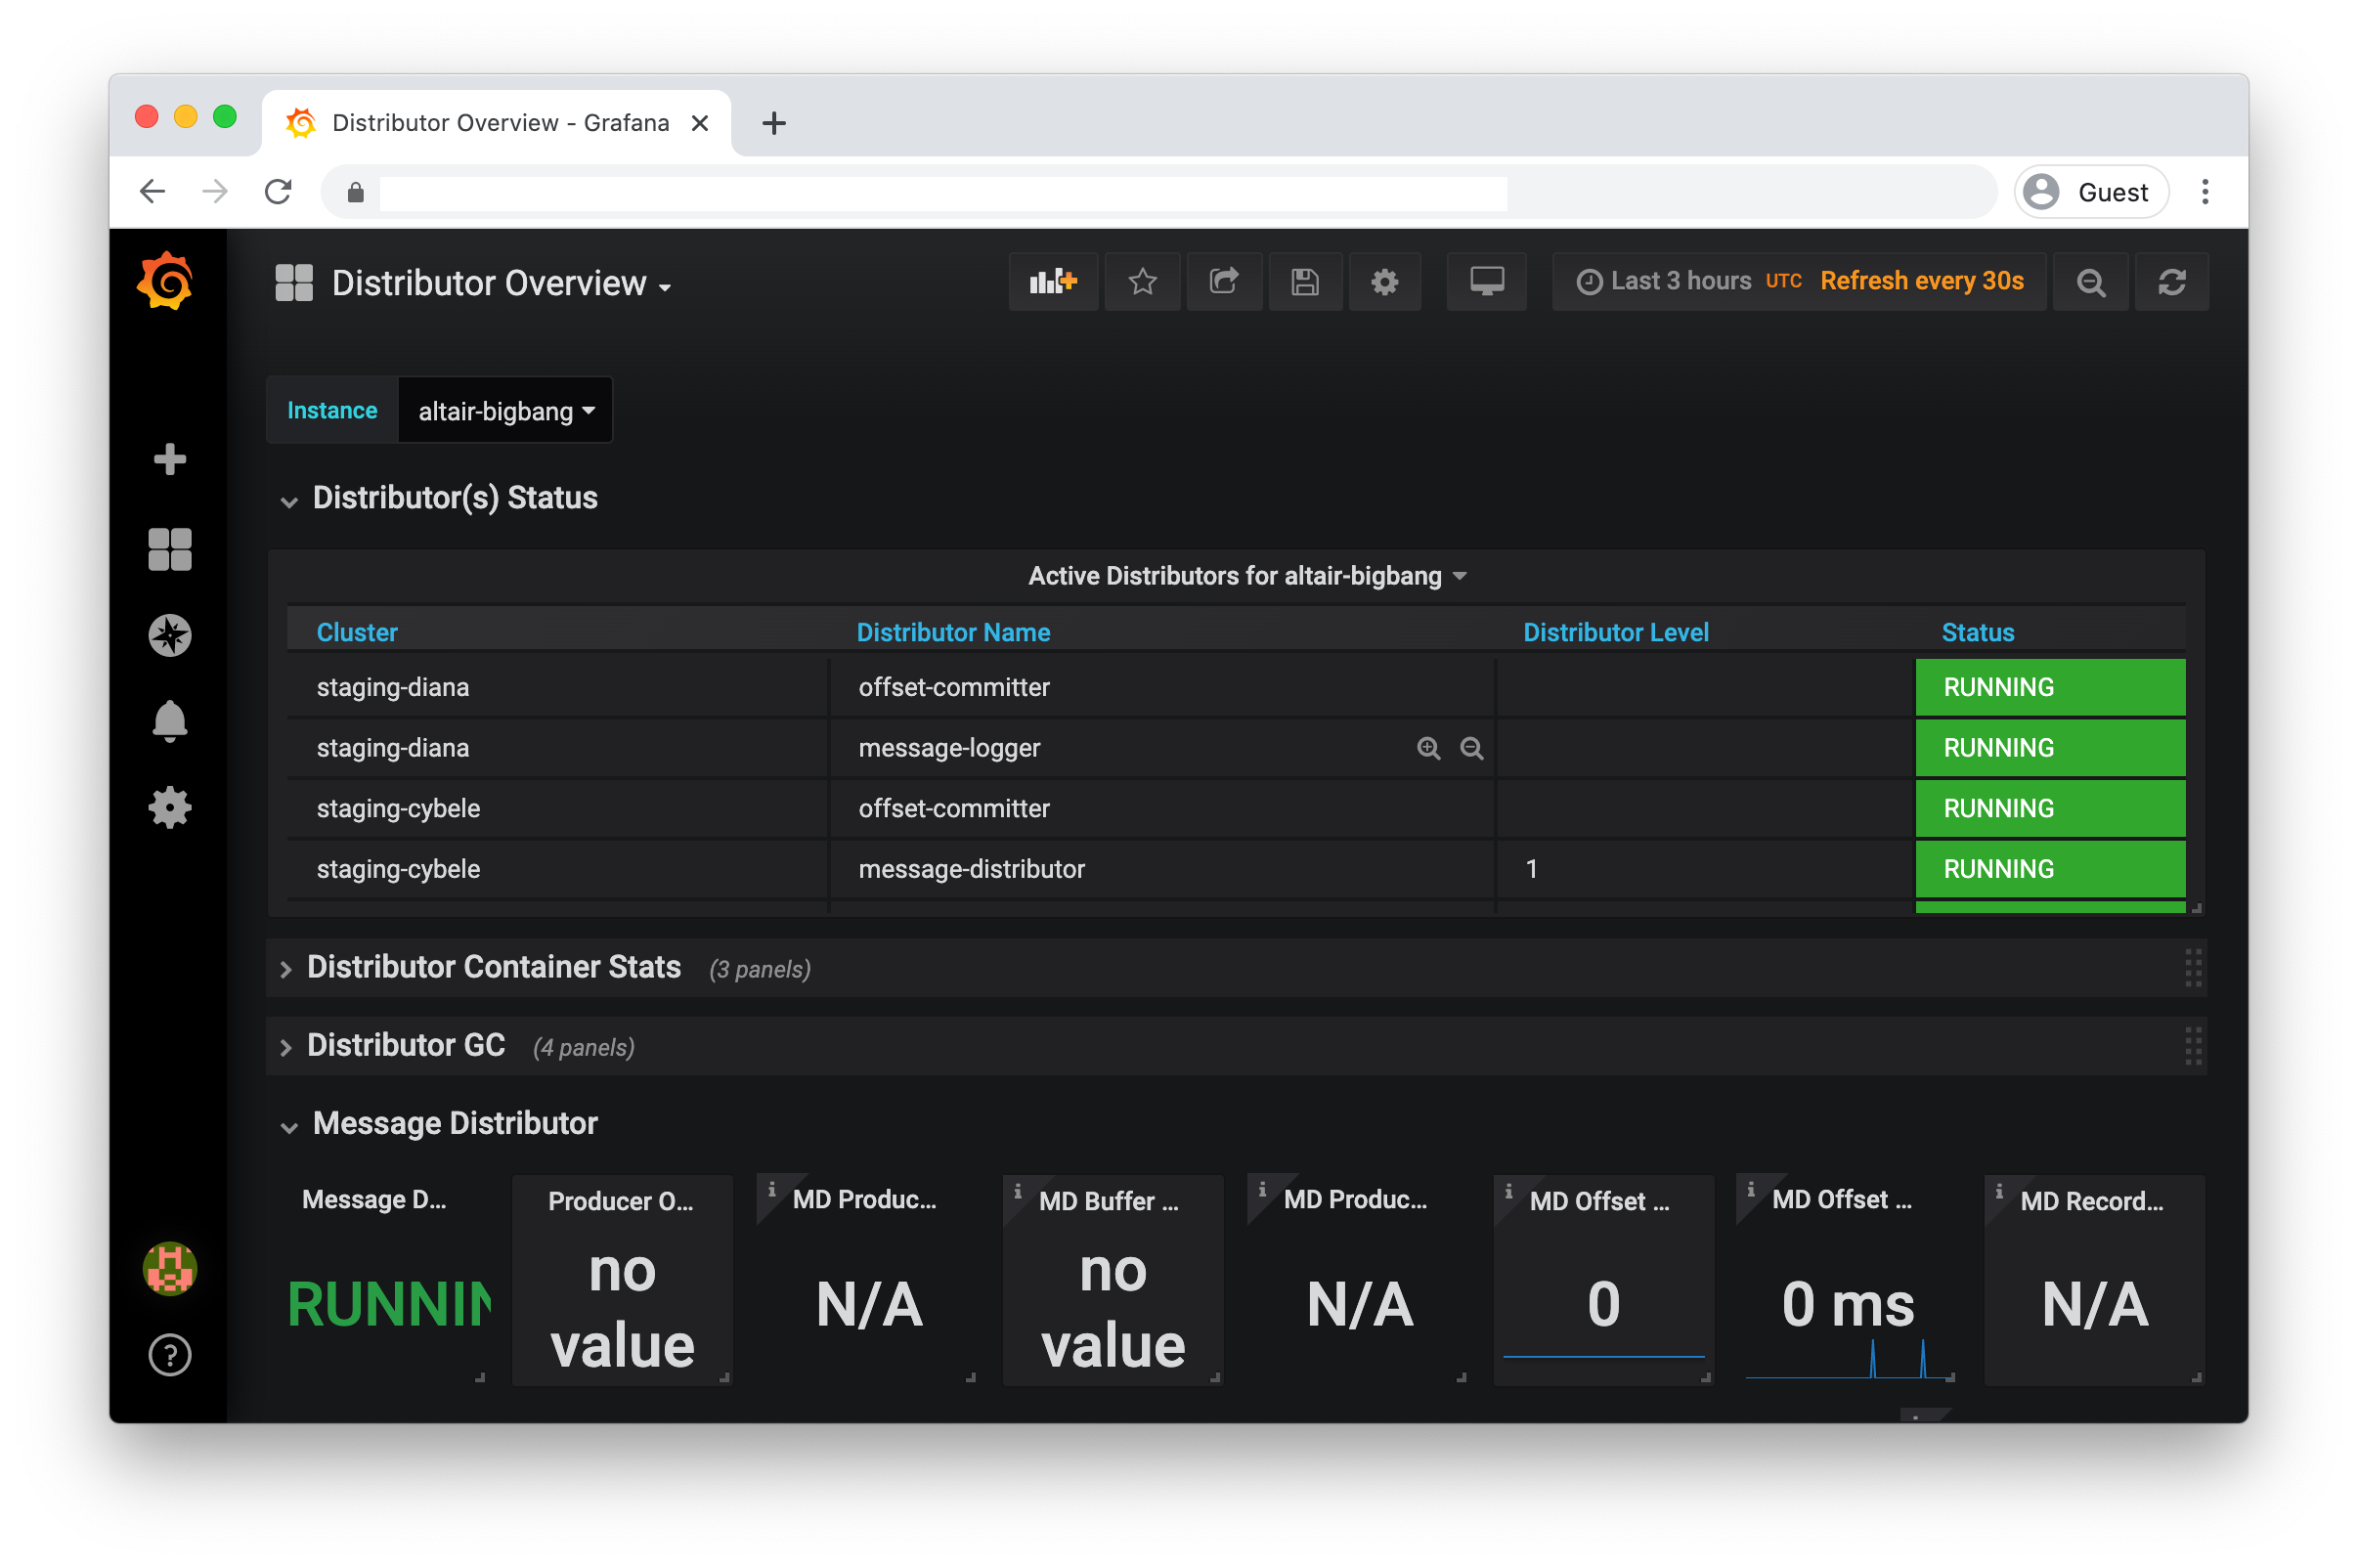
Distributor Overview |
|
Dashboard showing offset, schema and message distributor status and metrics |
VM Stats |
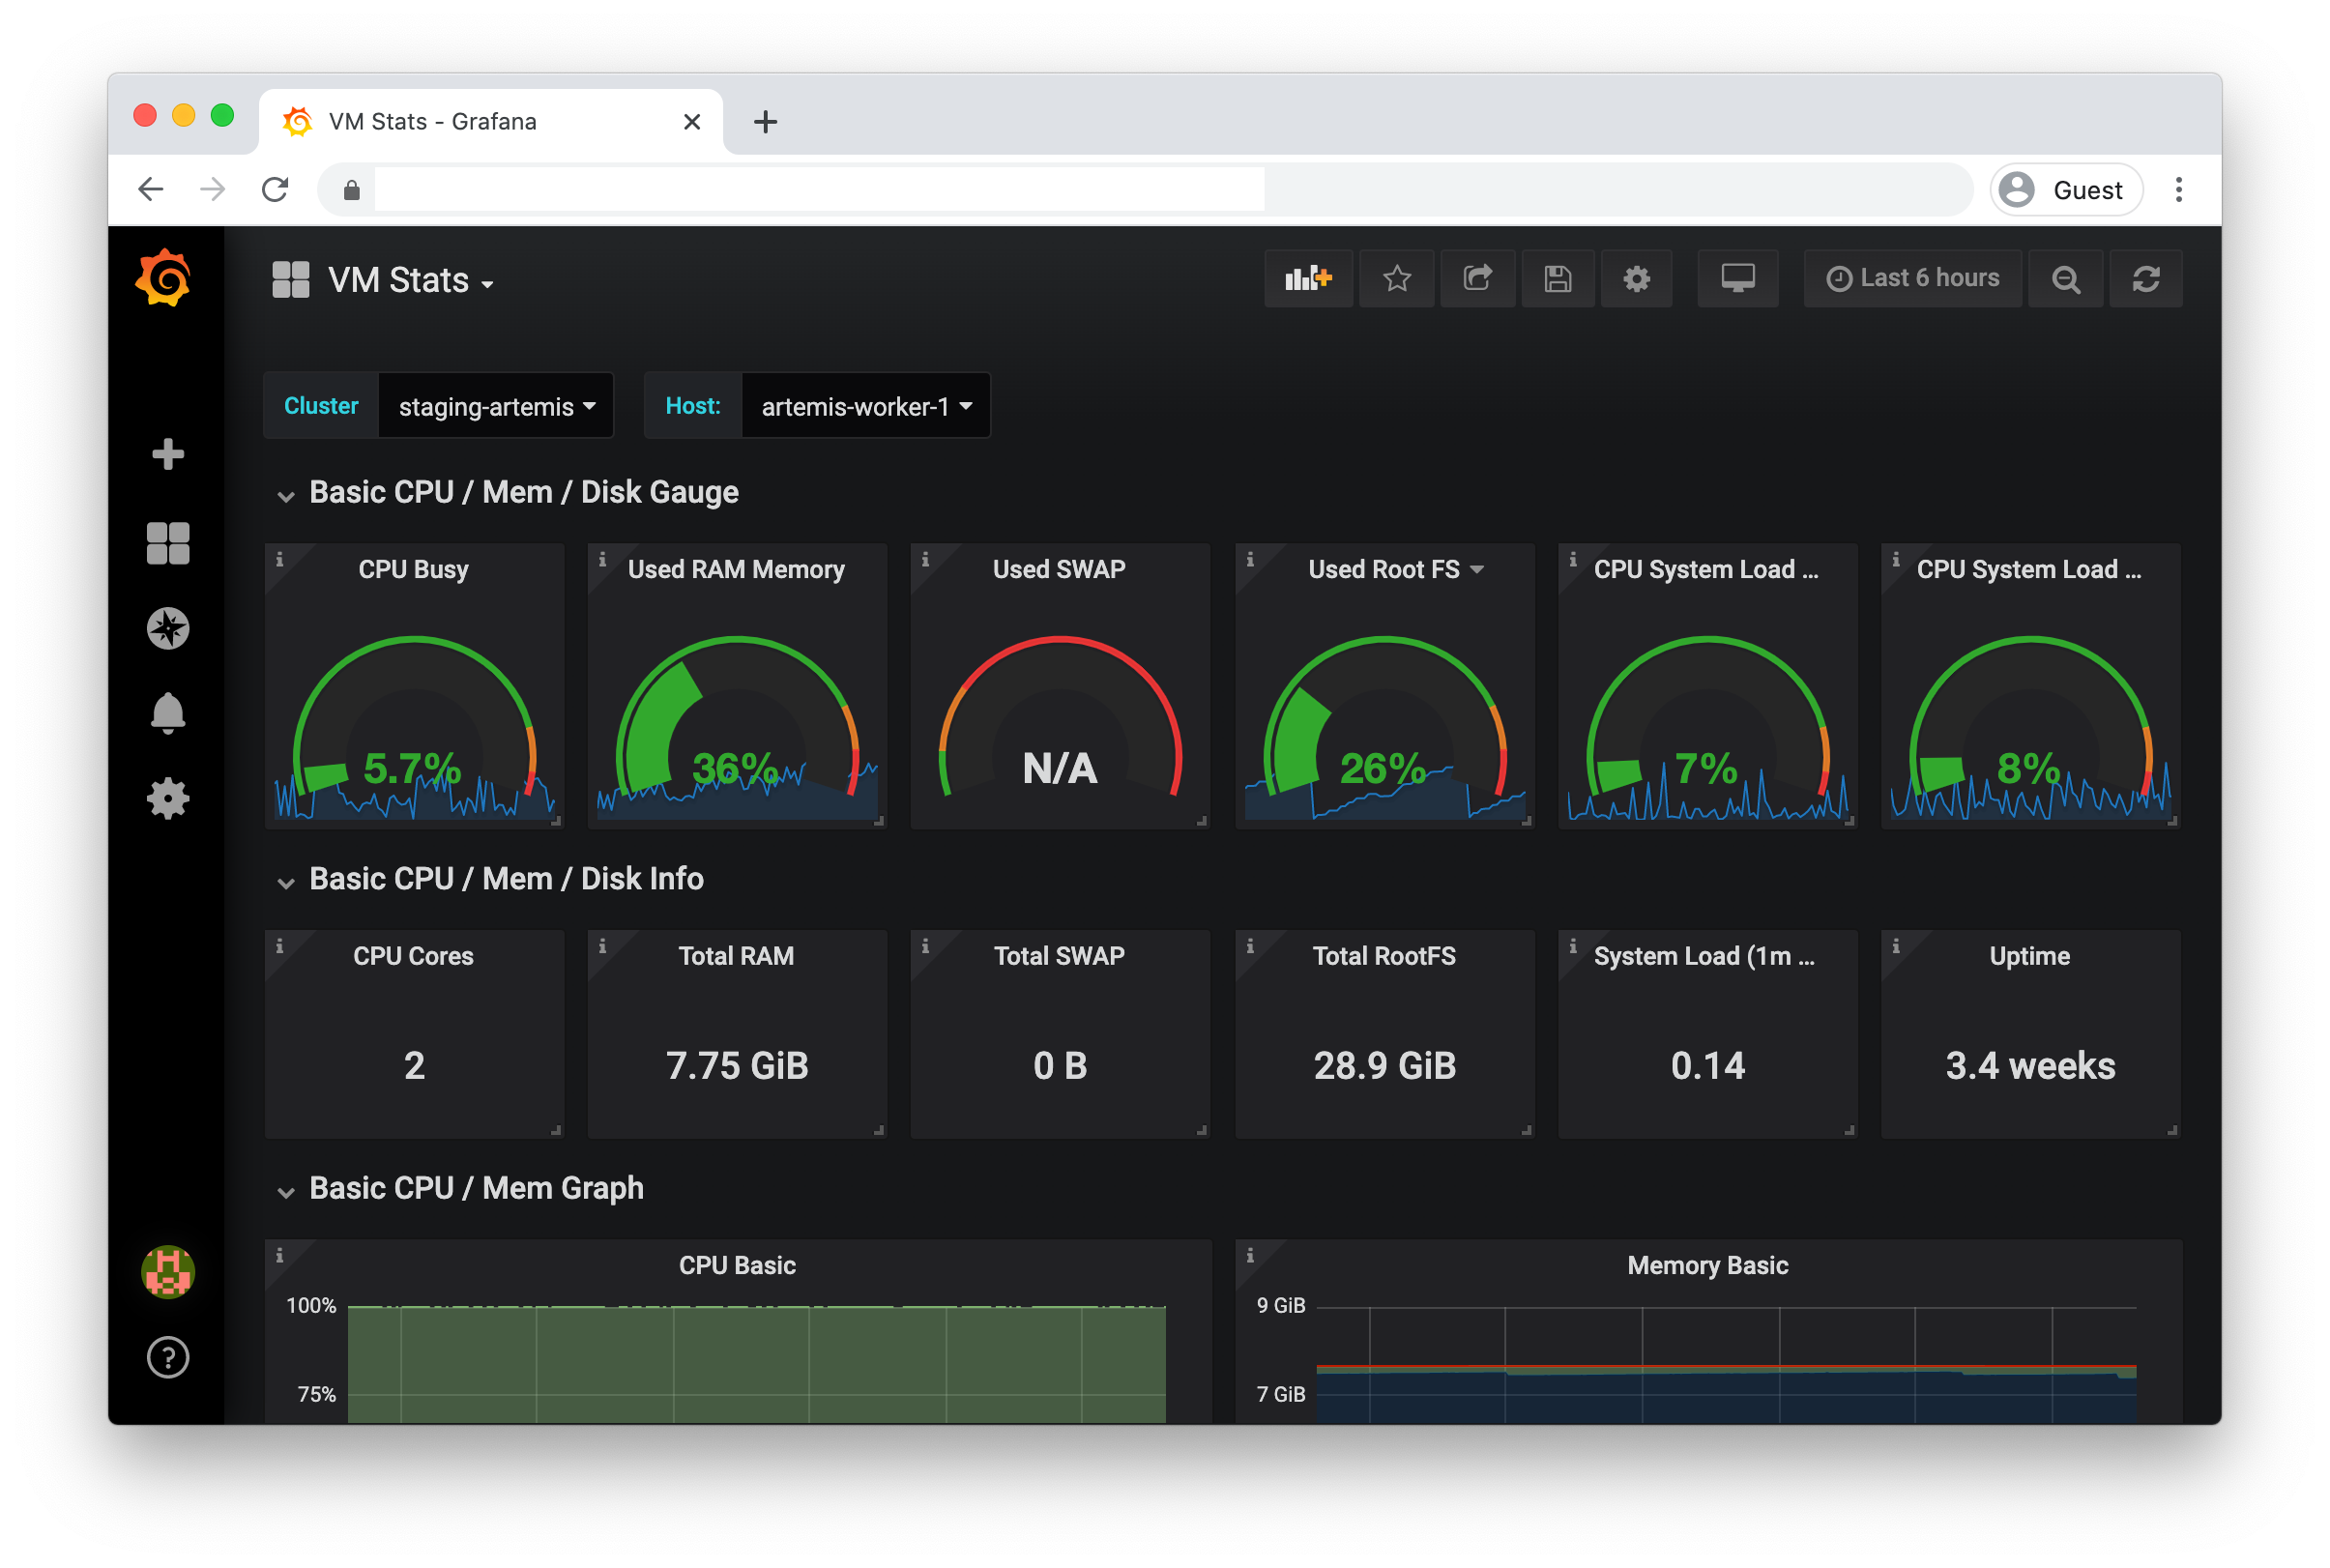
|
A useful dashboard to show a VM’s status, e.g. disk, CPU and memory usage |
Docker Monitoring |
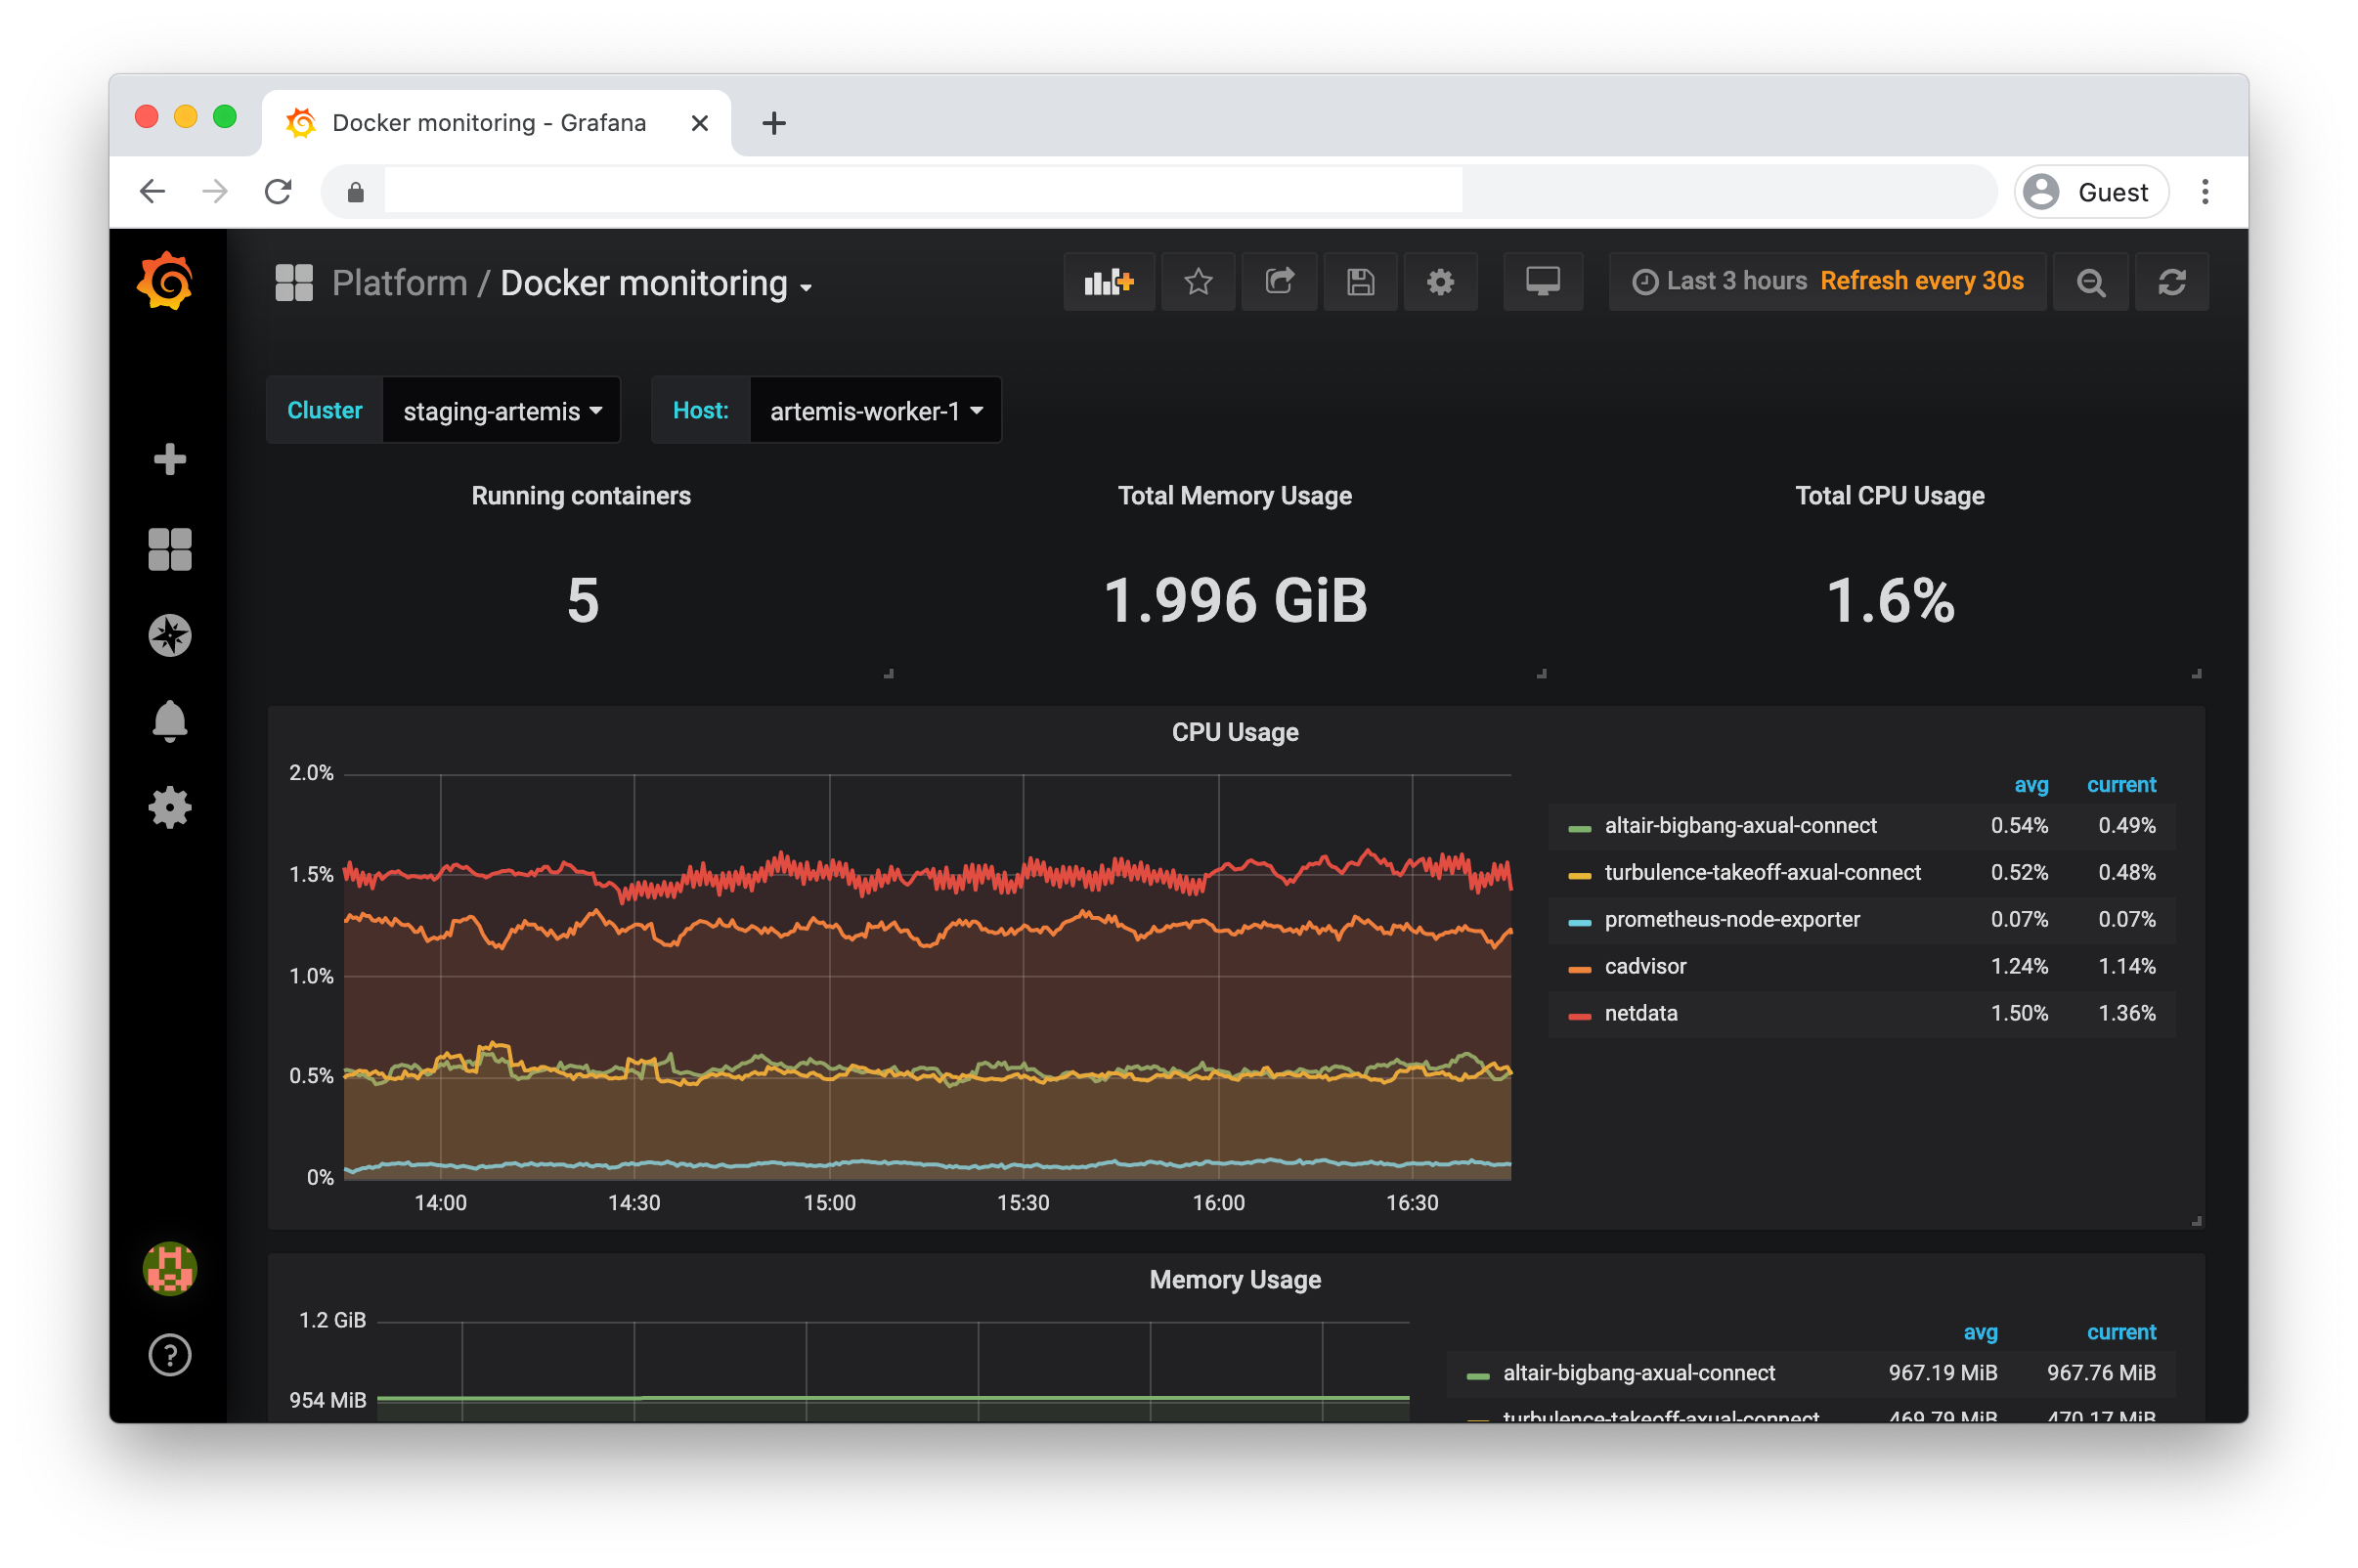
|
Dashboard zooming in on the Docker statistics of the VMs |
Prometheus Overview |
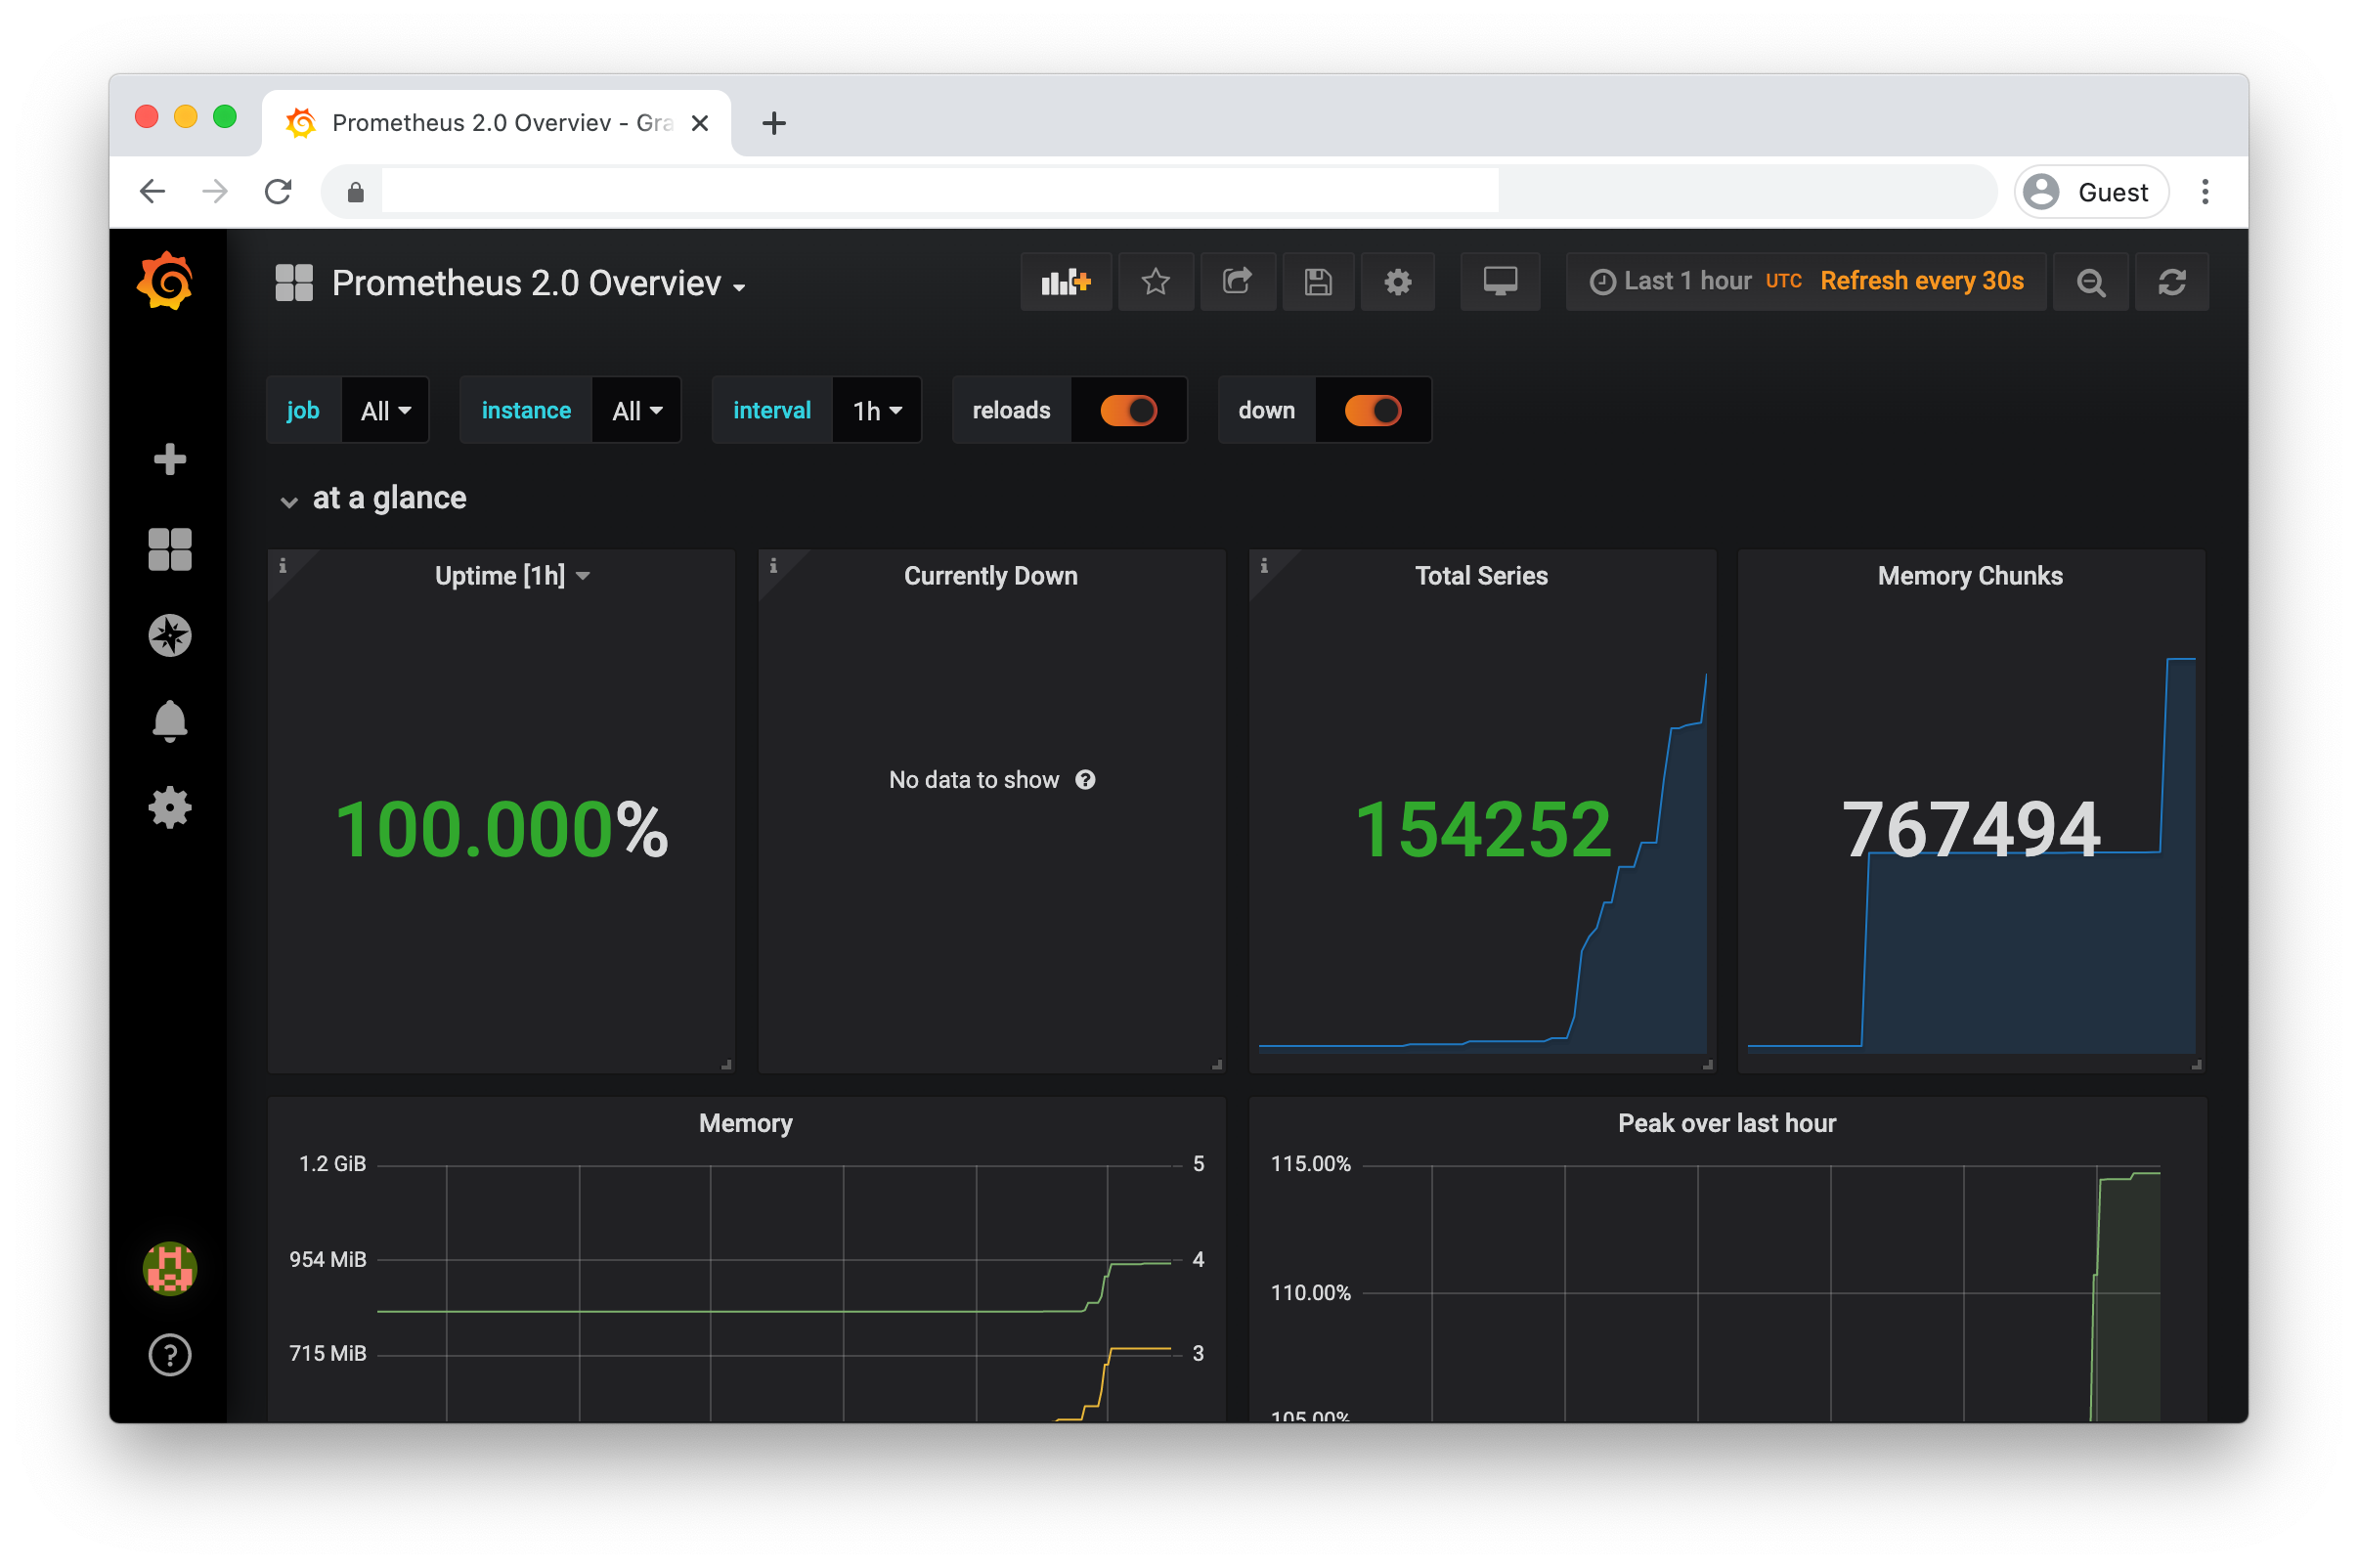
|
Dashboard used for checking Prometheus metrics |
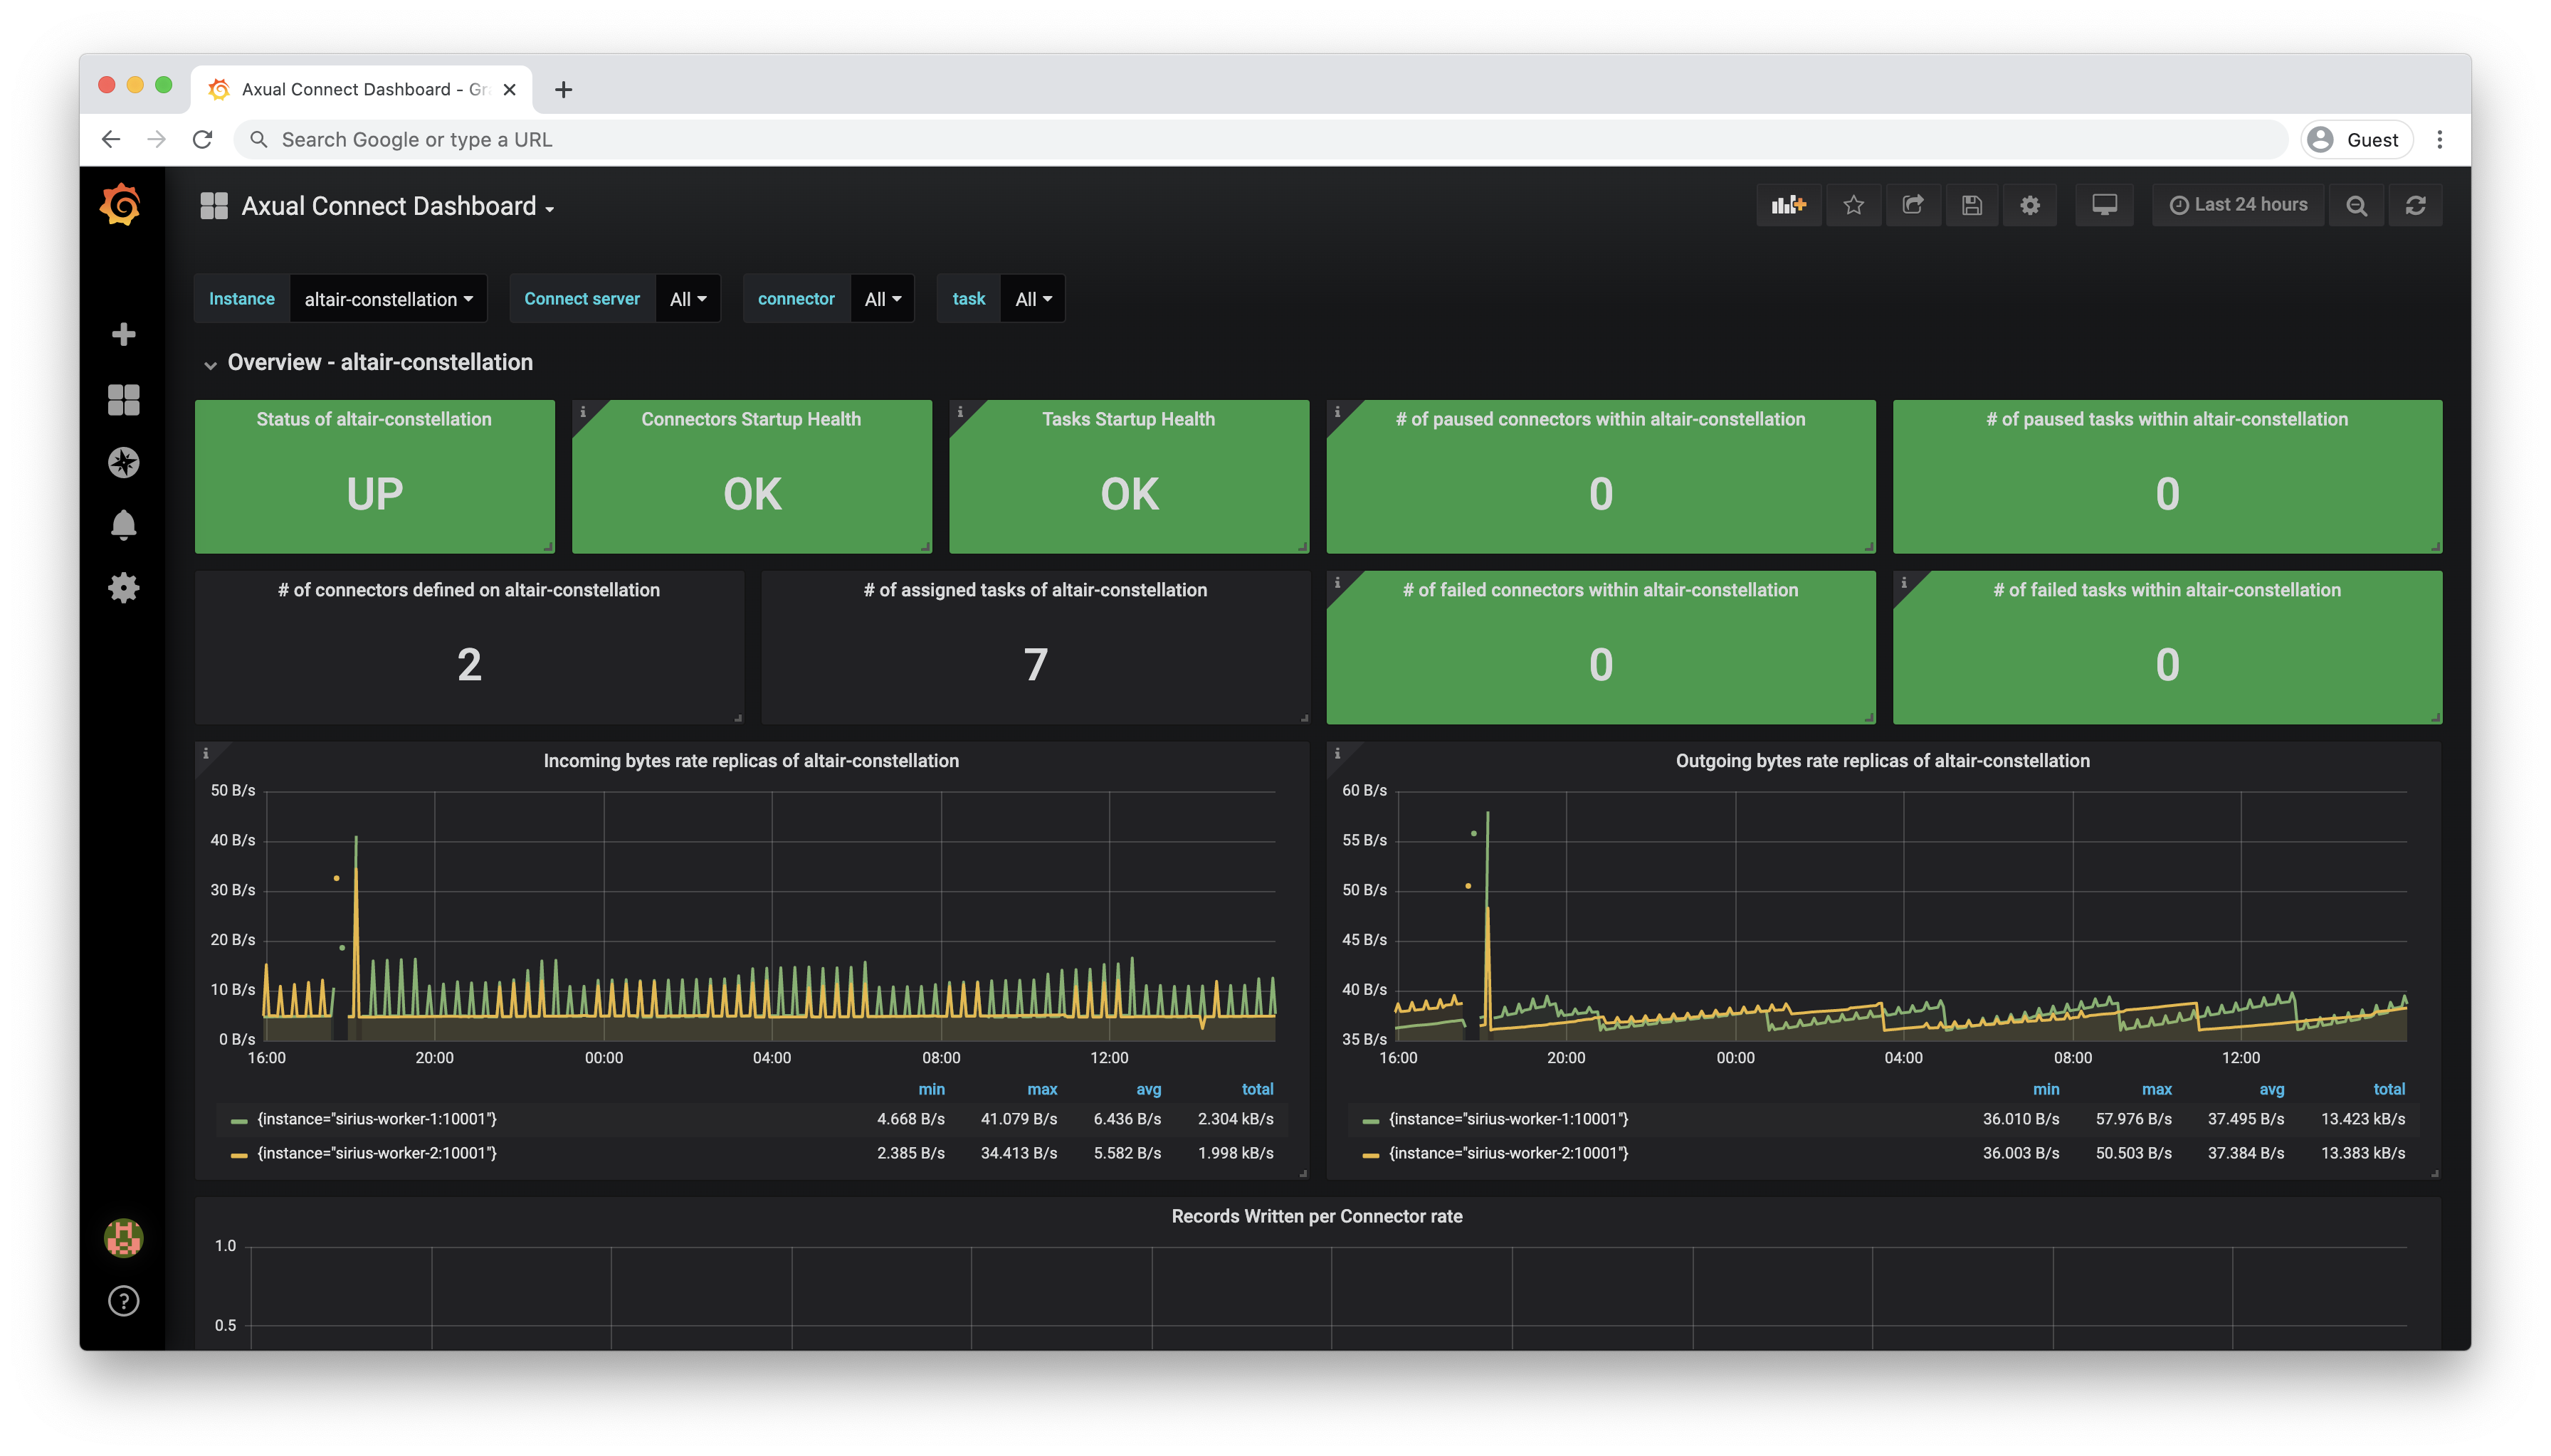
|
Dashboard provides a general overview of Connect service of a given instance |
|
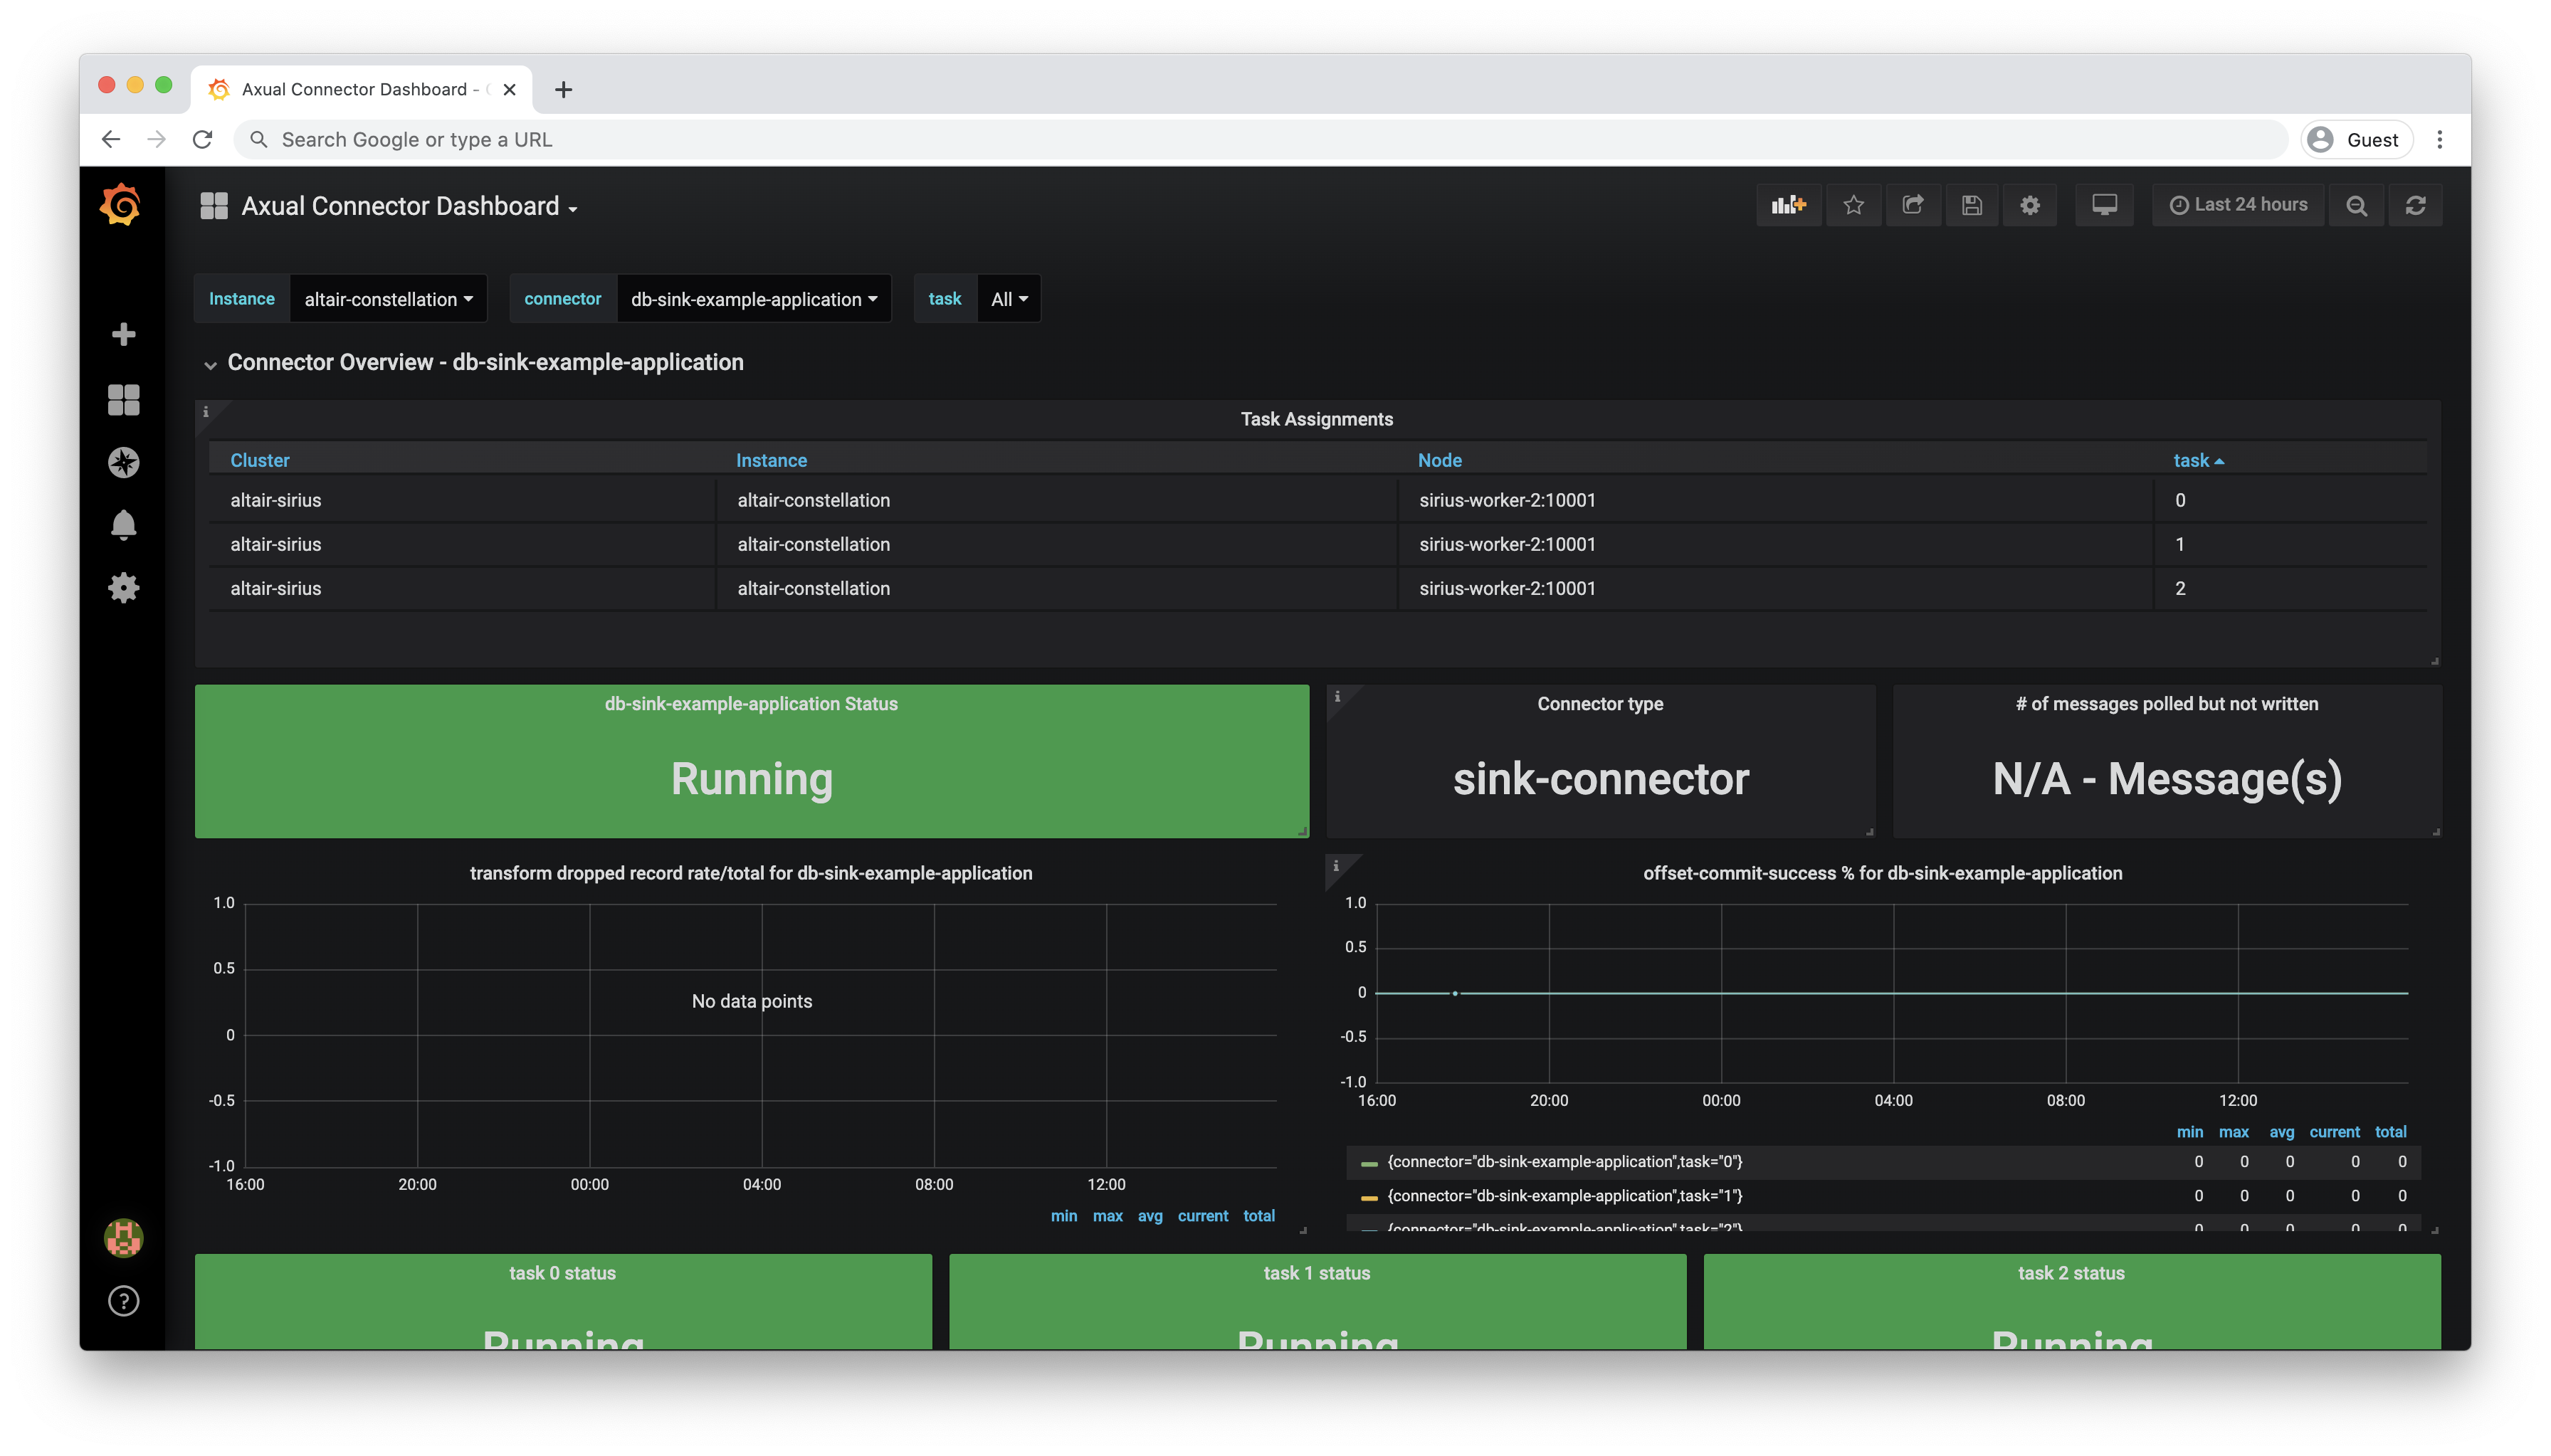
|
Dashboard which exposes metrics that concern individual connectors |
|
Rest-Proxy Detailed Overview |
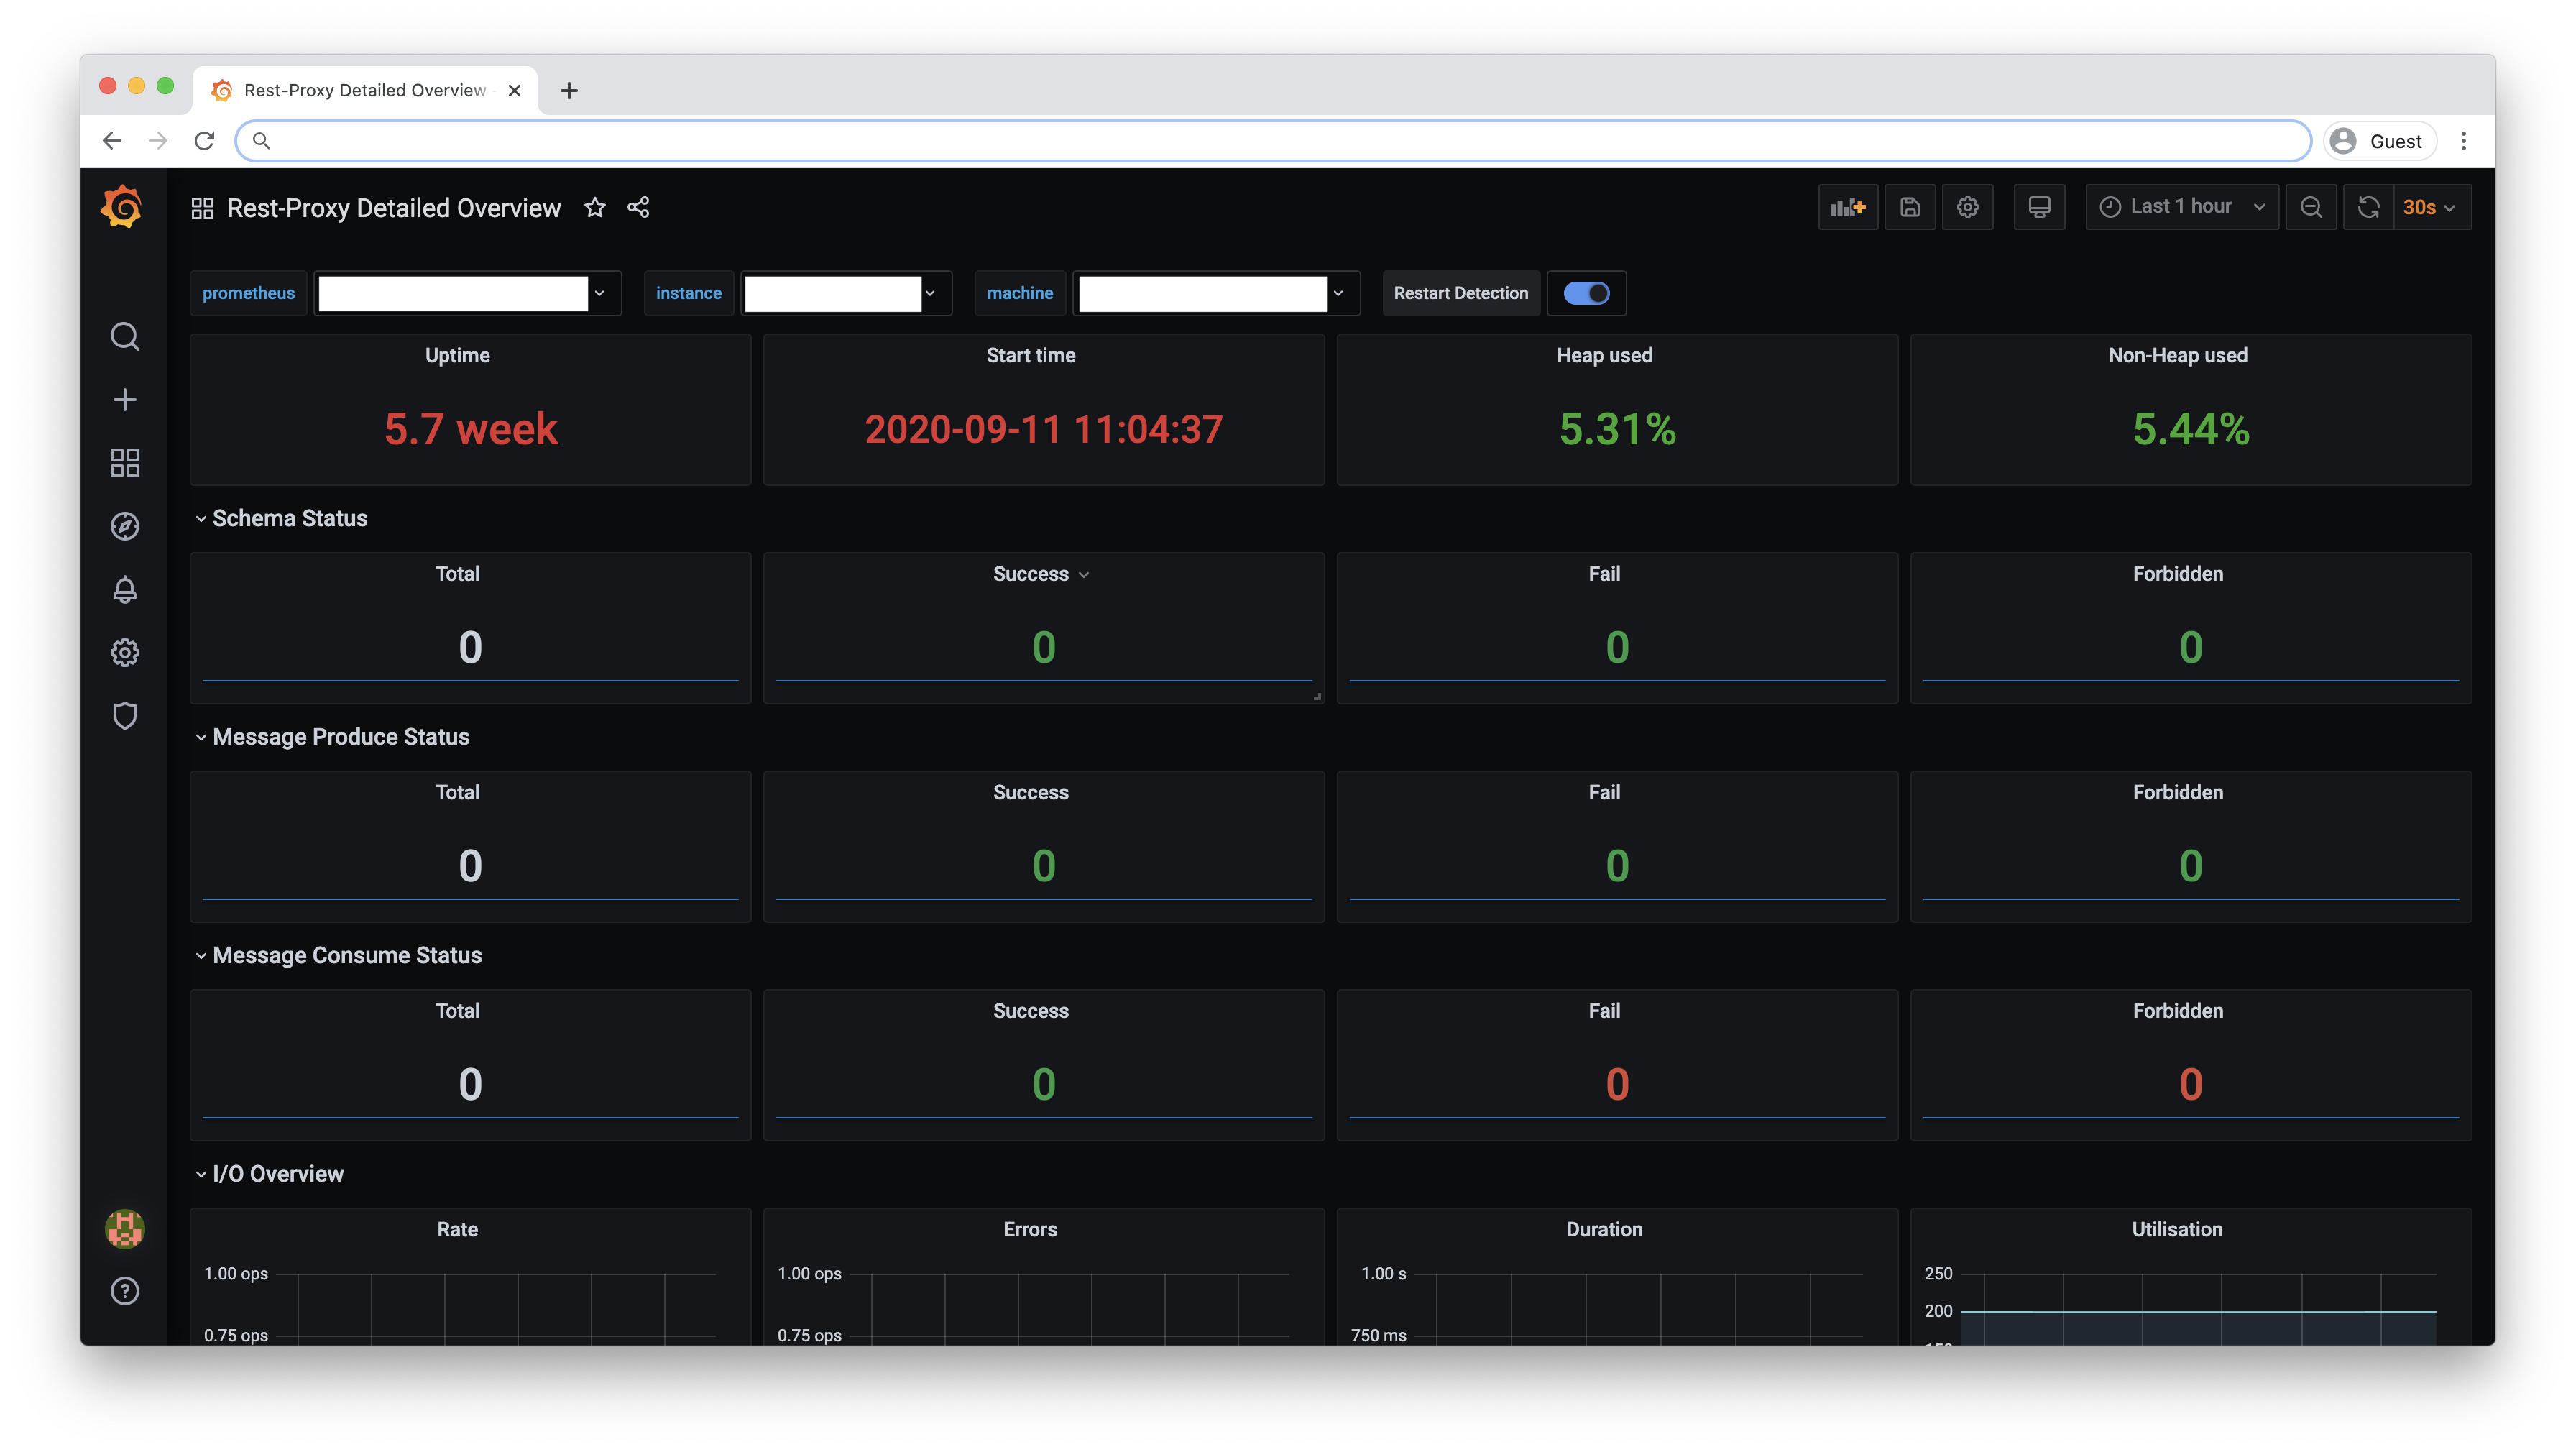
|
Dashboard which exposes metrics that concern to Rest-Proxy |
Cluster-API Detailed Overview |
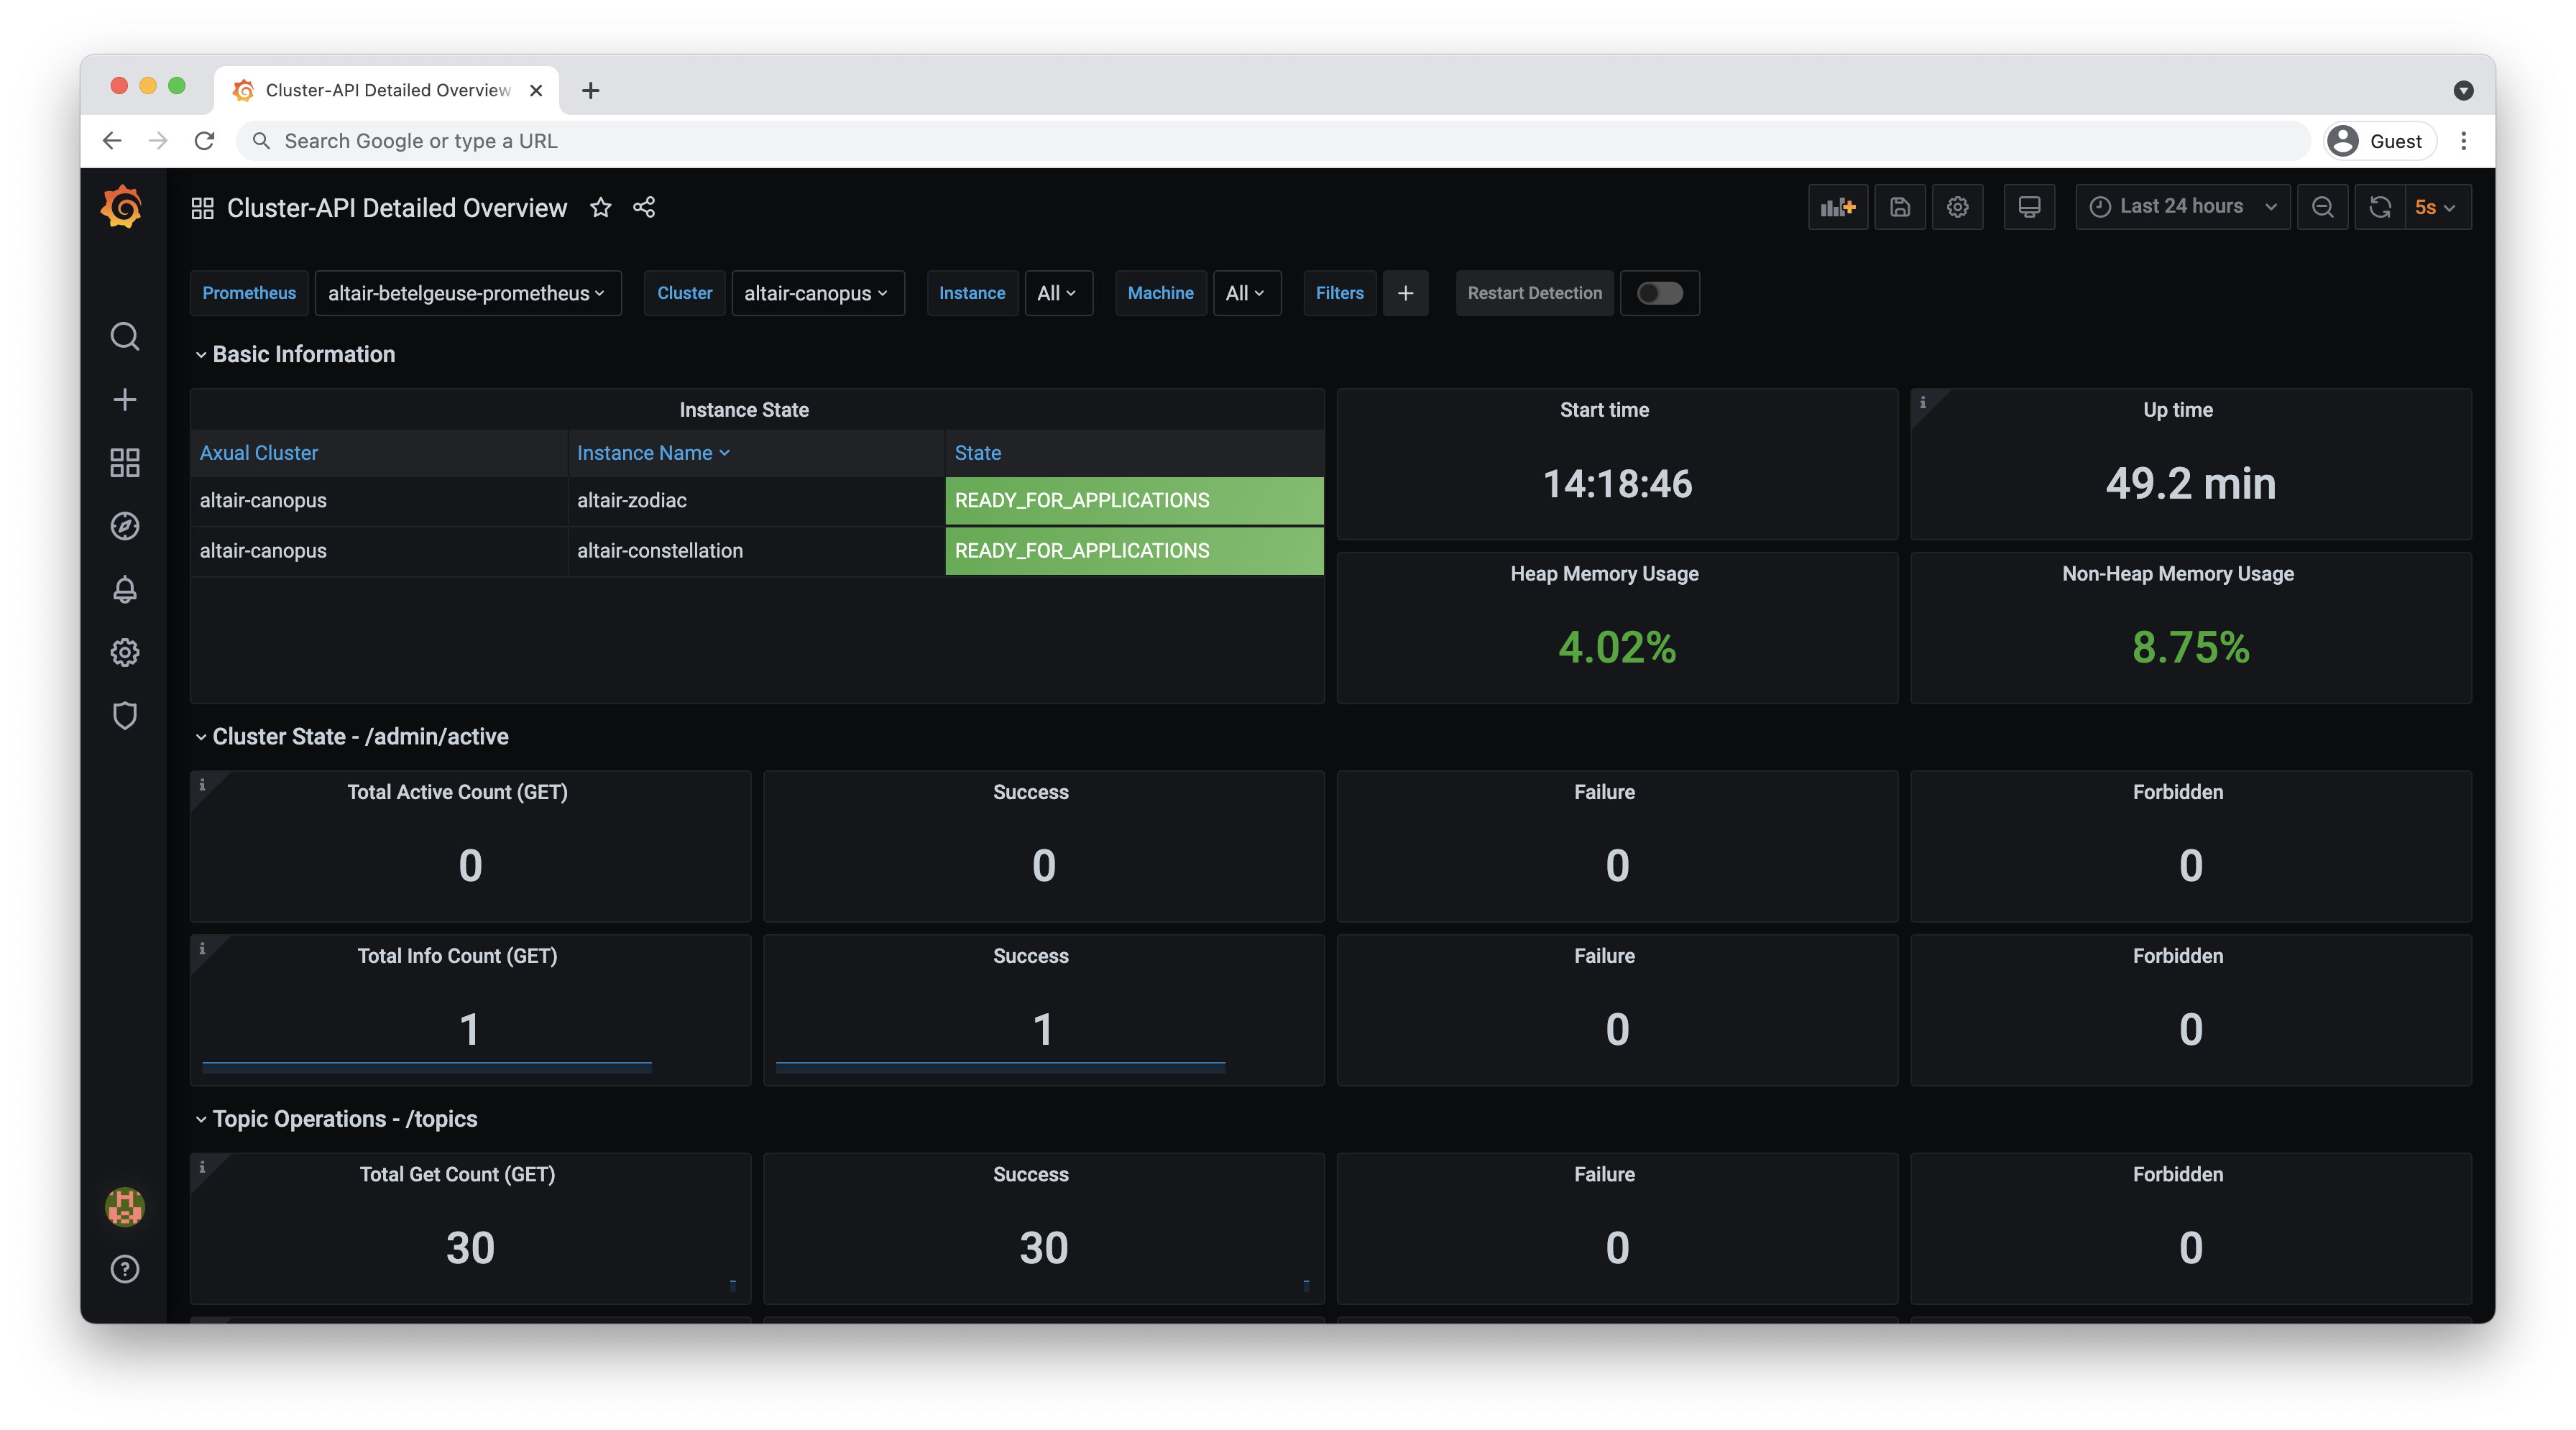
|
Dashboard which exposes metrics that concern to Cluster-API |
Message Delays |
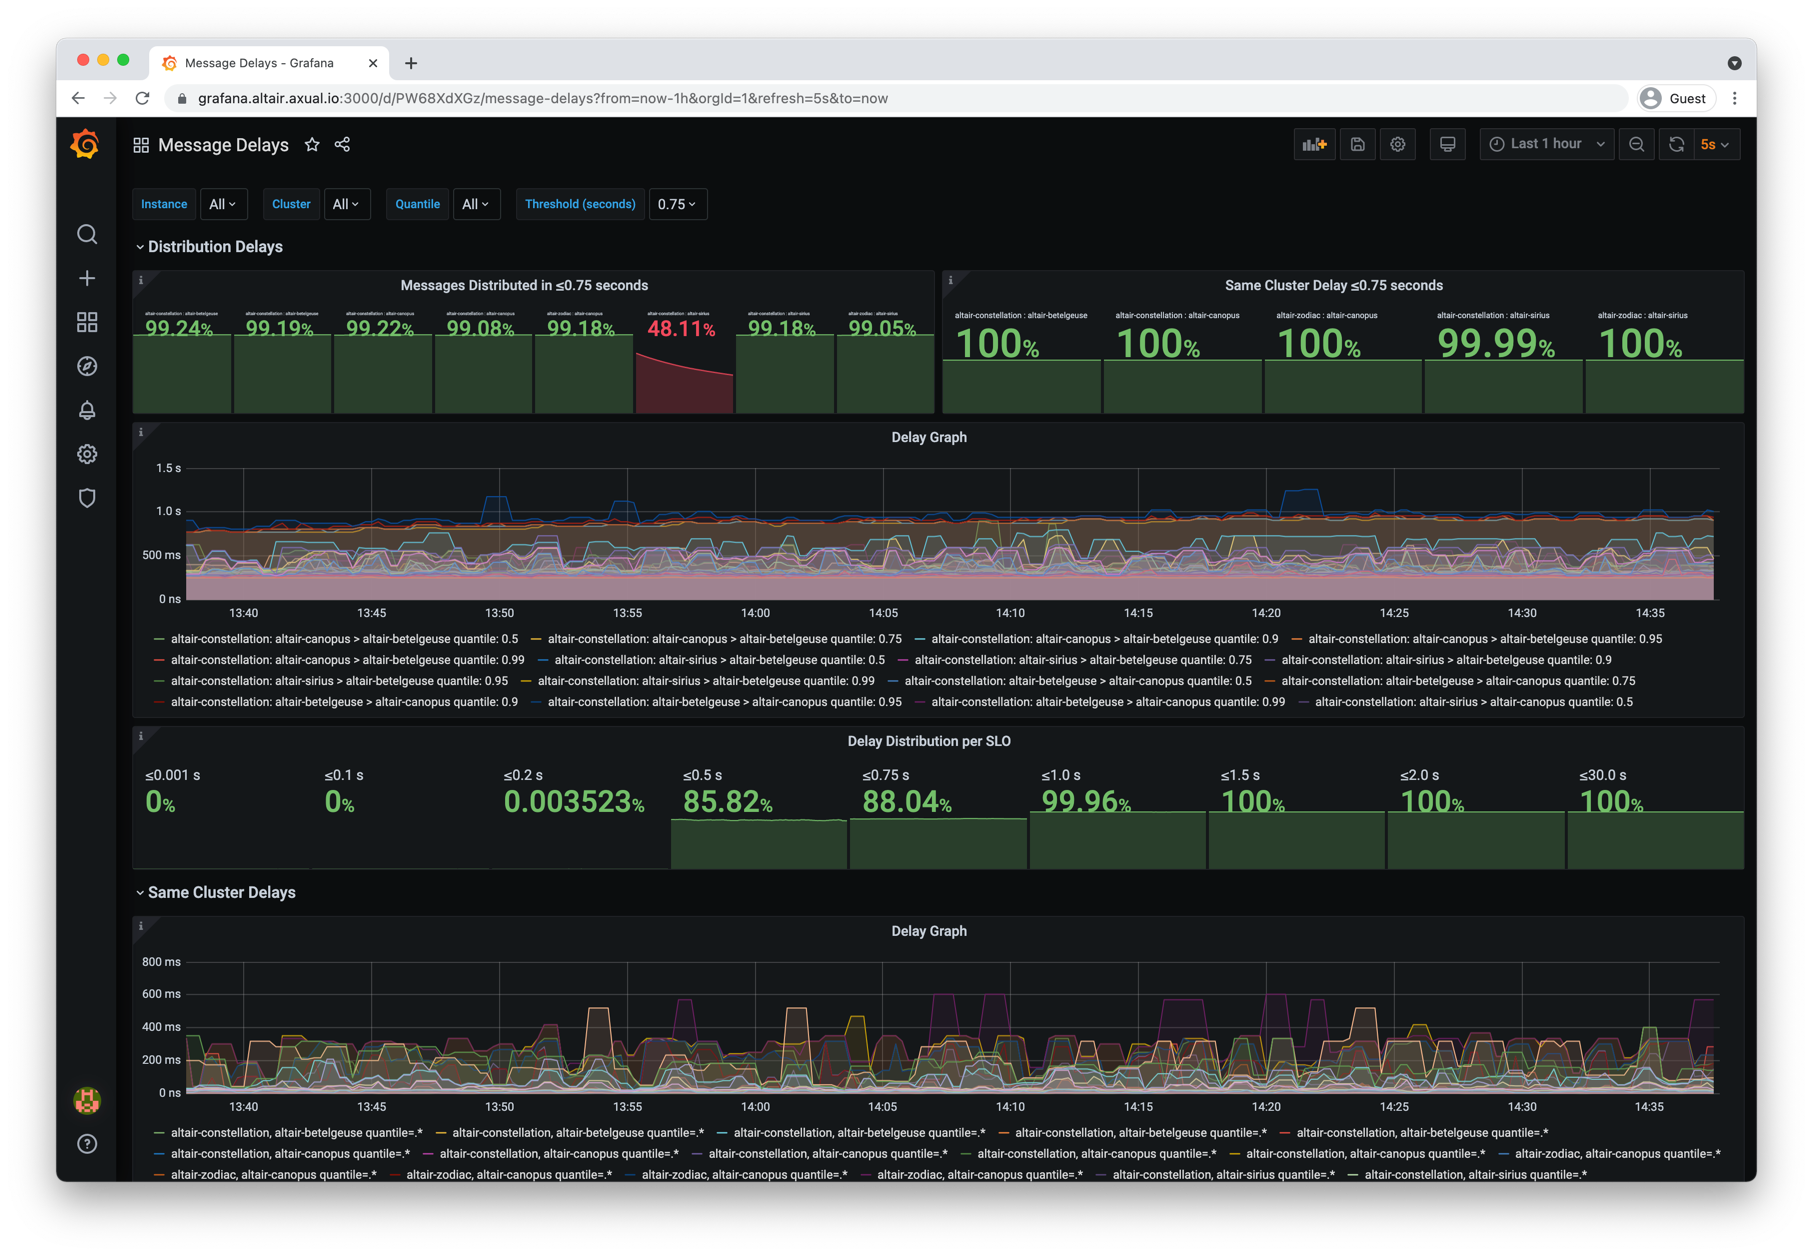
|
Shows the message end to end delays experienced inside an own cluster and after distribution |