Metrics retrieval
How Prometheus scrapes metrics
Prometheus leverages a so-called "pull mechanism", meaning that defined "targets" will be "scraped" on a set interval. The storage of these series of scrapes is sequential on disk, in custom format. There is no requirement for the storage itself, as long as it’s fast enough to keep up with ingress. More information to be found here. The generic configuration (shortened here) for what to collect looks like this:
global:
  scrape_interval:     20s
  evaluation_interval: 20s

rule_files: ['/prometheus/config/rules/*.yml']

scrape_configs:
- job_name: 'broker'
  file_sd_configs:
  - files:
    - /prometheus/config/targets/broker/*.json
- job_name: 'vm'
  file_sd_configs:
  - files:
    - /prometheus/config/targets/vm/*.json
- job_name: 'cadvisor'
  file_sd_configs:
  - files:
    - /prometheus/config/targets/cadvisor/*.json
- job_name: 'prometheus'
  file_sd_configs:
    - files:
        - /prometheus/config/targets/prometheus/*.json
- job_name: 'PickAname'
  scheme: http
  metrics_path: /actuator/prometheus
  tls_config:
    insecure_skip_verify: true
  file_sd_configs:
  - files:
    - /prometheus/config/targets/PickAname/*.json
- job_name: 'custom-tenant-apps'
  file_sd_configs:
  - files:
    - /prometheus/config/targets/tenant-apps/*.json
The referenced JSON files are populated by the Axual CLI, based upon cluster configuration files. scrape_interval and evaluation_interval are set to similar timings, but can be altered. The setting rule_files is related to Alerting.
Prometheus targets
When Prometheus is running, the current targets can be obtained by visiting the prometheus server and the list and status of endpoints is accessible through the web interface of Prometheus as well, via:
| If you decide to modify the YAML files, please be aware that YAML is based around indentation, one space too many or little and the entire configuration file will be deemed "corrupt". If this happens, the error isn’t really explicit, as it will not be able to precisely explain where this has happened (ie. give the wrong line number in the configuration file). Be sure to have an equivalent to "show whitespaces" setting enabled when editing these types of files. |
Querying metrics
Metrics can be queried using Prometheus directly, or via Grafana. Below you see some examples of Prometheus queries for different components.
Use "Graph" to execute those queries, it can be found in the top menu, or by visiting the following URL:
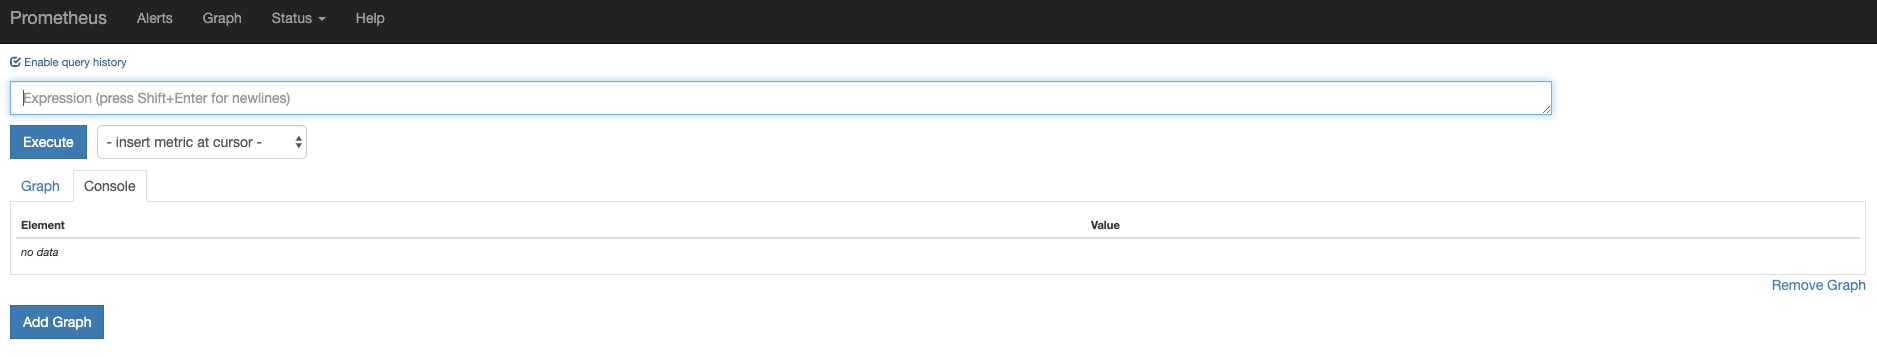
Example query
Below you can see an example prometheus query, obtaining a broker metric:
avg by(axual_cluster) (kafka_network_RequestMetrics_99thPercentile{name="TotalTimeMs",request="FetchFollower"})| Element | Value |
|---|---|
{axual_cluster="cluster-example1"} |
547.2866666666669 |
{axual_cluster="cluster-example2"} |
551.345 |
The results show that in both clusters, the 99 percentile of the Total time spent handling "Fetchfollower" requests (eg. other brokers catching up with partition leaders), is roughly 0.5 seconds (550ms).
Obtaining metrics directly from the service
Each endpoint defined (ie. with the setting <component>_PROMETHEUS_ENABLED= set to true, plus cAdvisor and Node exporter which are always enabled), is also directly accessible on the same url that Prometheus uses and will present the full list of metrics that are "exposed".
For example, the url
shows this:
# HELP jmx_config_reload_failure_total Number of times configuration have failed to be reloaded.
# TYPE jmx_config_reload_failure_total counter
jmx_config_reload_failure_total 0.0
# HELP jvm_buffer_pool_used_bytes Used bytes of a given JVM buffer pool.
# TYPE jvm_buffer_pool_used_bytes gauge
jvm_buffer_pool_used_bytes{pool="direct",} 3.4966002E7
jvm_buffer_pool_used_bytes{pool="mapped",} 1.05050053816E11
...
{omitted}
...
We’re not going to list them all, as that’s far too much information. The metrics that are exposed are listed here.
The registered mbeans and recorded metrics carry the same names, but using different syntaxes.
Mbean:
kafka.server:type=BrokerTopicMetrics,name=MessagesInPerSecMetrics:
kafka_server_BrokerTopicMetrics_Count{name="MessagesInPerSec",topic=dummy,}
kafka_server_BrokerTopicMetrics_FifteenMinuteRate{name="MessagesInPerSec",topic=dummy,}
kafka_server_BrokerTopicMetrics_FiveMinuteRate{name="MessagesInPerSec",topic=dummy,}
kafka_server_BrokerTopicMetrics_MeanRate{name="MessagesInPerSec",topic=dummy,}
kafka_server_BrokerTopicMetrics_OneMinuteRate{name="MessagesInPerSec",topic=dummy,}