Monitoring Axual
The Axual monitoring stack
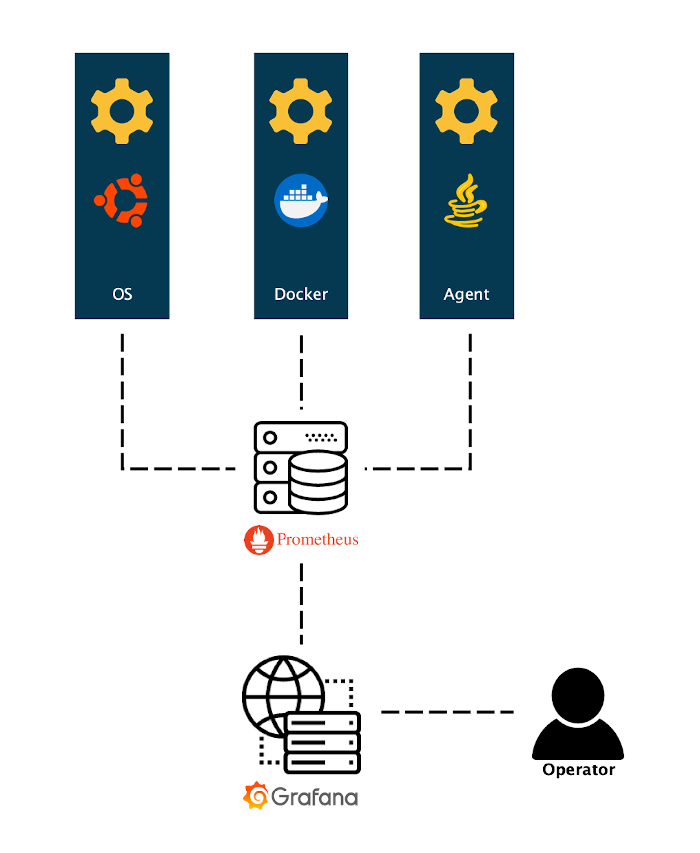
Axual offers support for the following components in the management stack, and also offers it alongside the platform, in case there is need for a monitoring stack as well: This monitoring stack consists of the following services:
|
|
| Check the Release Notes for specific version information for the services mentioned above |
Where to access the monitoring services' management interface.
Where to access your monitoring services' management interface depends on your deployment. Please refer to the following configuration files for each service, and change the endpoint URL based on your configuration.
Service |
Configuration file |
Service management endpoint* |
Prometheus |
|
|
Grafana |
|
|
Alertmanager |
|
|
The endpoint host is dependent on in which node.sh file the service has been enabled, and of course the IP address or hostname of that particular host.
|
Enabling service monitoring
For every service in Axual, monitoring has been added in a unified way and enabled by you by setting two settings in the <service>.sh file:
-
[SERVICE]_PROMETHEUS_ENABLED=yeswhether to enable prometheus for this service or not -
[SERVICE]_PROMETHEUS_PORT=[SERVICE_NODENAME]:[SERVICE_PORT]referring to the endpoint on which the service exposes prometheus metrics.
How are service metrics being retrieved
This is explained in Retrieval of metrics.