Alerting
Introduction
While running the operation, you don’t want to have just information, you most likely want some notifications about "abnormalities" as well. An alert is nothing more than a prometheus query which does not meet the opposing criteria. Think: "Average CPU utilization over the past 5 minutes higher than 60%", "Number of running broker instances lower than 3", or "Number of unreachable scraping targets is not equal to 0". The configuration is done in YAML based configuration file(s).
To provide this there’s a module included in Prometheus called "Alert manager". It queries Prometheus with set rules (remember the rule_files line?), and is exposed on its own web interface. The port is declared with the setting ALERTMANAGER_PORT=.
example:
Will show the currently active alerts.
Generic configuration
This is the default configuration that is provided:
global:
  # The smarthost and SMTP sender used for mail notifications.
  smtp_smarthost: '<smtp-server>:<port>'
  smtp_from: '<address>'
  smtp_auth_username: '<username>'
  smtp_auth_identity: '<from_name>'
  smtp_auth_password: '<password>'
  smtp_require_tls: <true/false>

  # An alert is considered resolved if it's not firing for this long
  resolve_timeout: 10m

# Alerting tree starts here
route:
  # Alerts with the same name are considered a group. We work on group level, not on notification level.
  group_by: ['alertname', 'axual_cluster']

  # When a notification starts the chain for a group, wait for 30s before sending the notification. (maybe more will come)
  group_wait: 30s

  # Send the next batch of notifications for the same alert group only after waiting 5m.
  # E.g. Server #1 fires at t=0s, #2 fires at t=25s, #3 at t=1m, #4 at t=3m, #5 at t=5m20s
  #    then alerts [#1 and #2] will be grouped together and [#3 #4 #5] will form a second group, for a total of 2 notifications.
  group_interval: 5m

  # If an alert hasn't been solved for this amount of time, then repeat the notification this often
  repeat_interval: 1d

  # The default receiver for notifications (if no match in the routes subtree)
  receiver: 'insert-name-hook'

  #Specific scenarios subtree
  routes:

  # Alerts which have the 'severity' label and the value set to 'high' will trigger a send an email to people's mailboxes
  - match:
      severity: high
    receiver: 'insert-name-emails'
    continue: true

  # Last receiver in the routes tree is slack
  - receiver: 'insert-name-hook'

receivers:
  - name: 'insert-name-emails'
    email_configs:
      - to: 'address1@axual.com'
        send_resolved: true
      - to: 'address2@axual.com'
        send_resolved: true

  - name: 'insert-name-hook'
    email_configs:
      - to: 'addressofhook@name.slack.com'
        send_resolved: true
This configuration indicates 2 types of alert-notifications:
-
All alerts are sent to Slack (which is a hook that is defined in the Slack server)
-
All alerts labeled "severity: high" will also - so not in stead - be sent to 2 email addresses
Due to the settings group_wait and group_interval alerts will be bundled into single messages where applicable, reducing the amount of messages you receive (not the amount of alerts in total, they are all mentioned)
|
Alerts
example:
groups:
- name: LinuxRules
rules:
- alert: HighCPULoadAverage
expr: 100 - (avg by (axual_cluster) (rate(node_cpu_seconds_total{mode="idle"}[5m])) * 100) > 50
for: 180s
labels:
severity: medium
annotations:
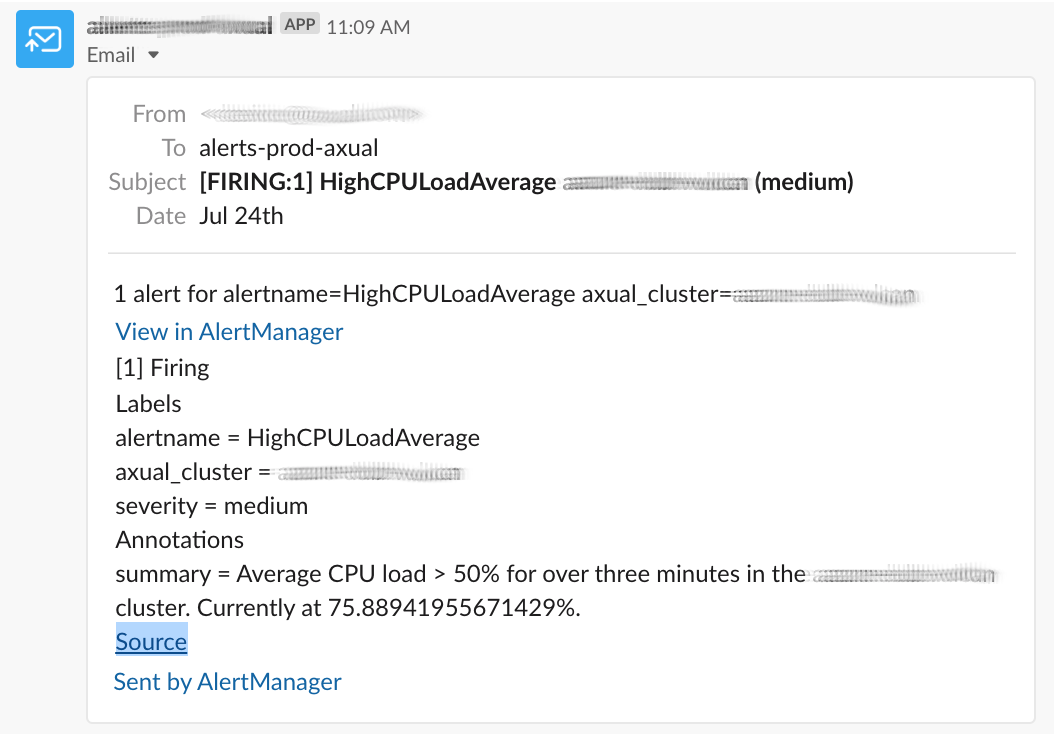
summary: "Average CPU load > 50% for over three minutes in the {{ $labels.axual_cluster }} cluster. Currently at {{ $value }}%."The result in our media will look like this:
Silences
| Be very careful with this. An oversight or a wrongly configured silence might lead to production downtime and customer impact! |
If at some point you’re seeing alerts which are unwanted (eg. executing a change) or not correct (wrong threshold or metric perhaps?) then you could update the configuration (ie. change scraping targets) and restart the application, but that would entail the entire prometheus instance, which will take a while and make you lose metrics for a period of time. The suggested method would be to create a (temporary) silence, which will suppress any matching currently active and future alerts.
Say for instance, you need to do a full restart of "serverA", then you could create a silence for 1 hour that matches instance="serversA".
Or there’s an ongoing issue where you have high loads on the system, but you are aware of it and don’t want to be called at 02.00 on a Sunday. So you create a silence for 2 weeks, matching alertname=~".*CPU.*" (making sure the box "regex" is ticked).
example:
will show the currently actives Silences.
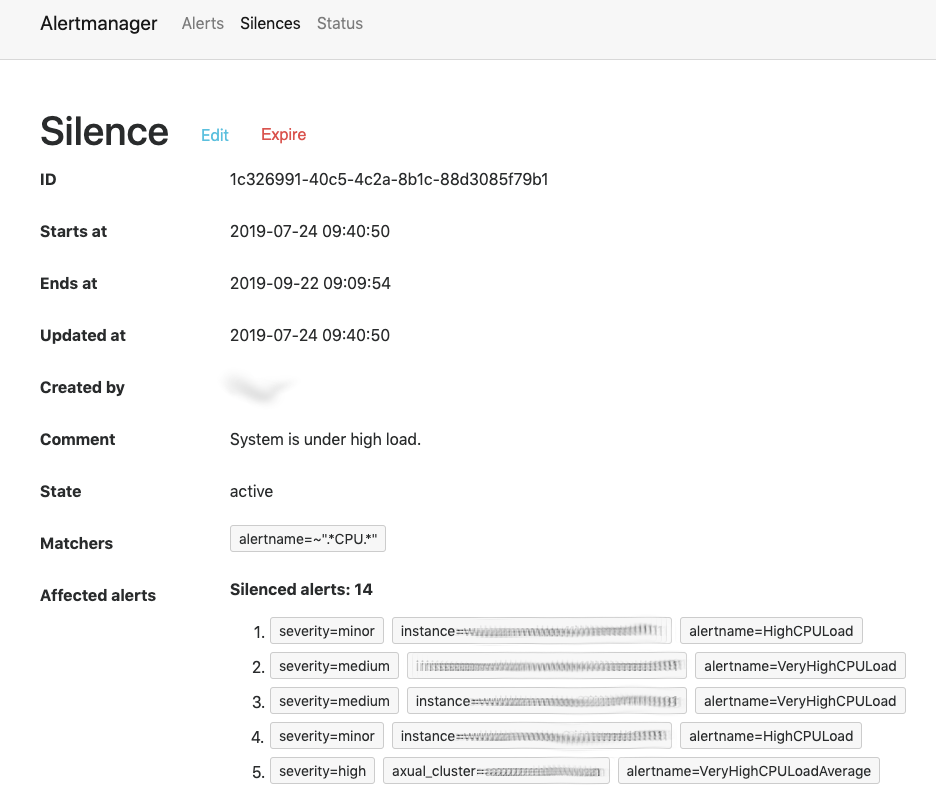
Here a single regular expression blocks 5 alerts, span across 3 severities, 3 alert names and 2 components (1 instance, 1 cluster).