Monitoring
Introduction
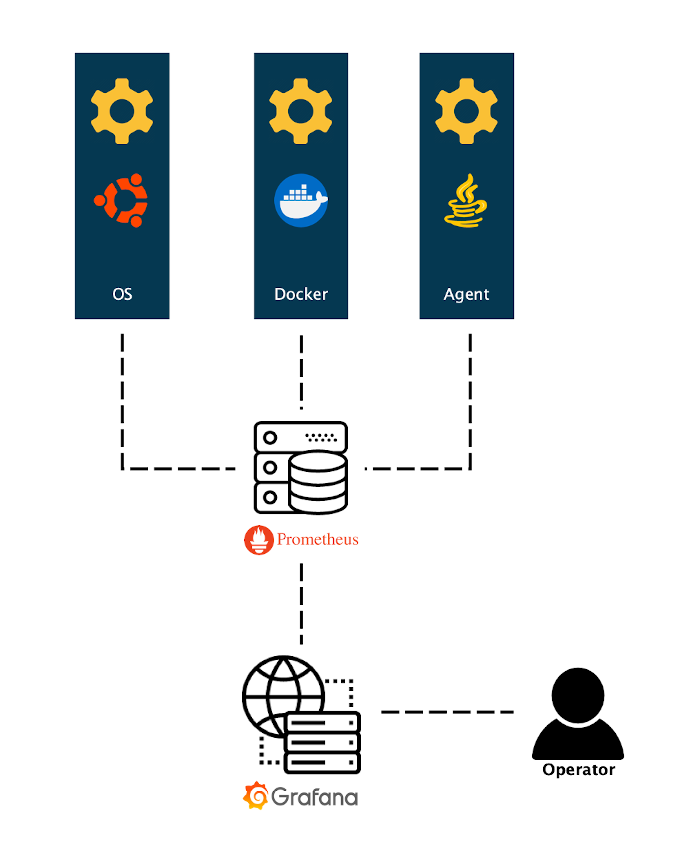
Out of the box, our deployment gives you the option to install a monitoring setup alongside it. This setup (or stack) consists of the following components:
-
cAdvisor is used to report utilization statistics for all Docker containers running on a Host (ie. the machine that runs the Docker containers)
-
Node exporter is used to report Host statistics
-
Prometheus is used to aggregate and store, while providing centralized access to other components' metrics. For this a Time Series Database is used. More information provided by Prometheus.
-
Alertmanager is a component of Prometheus that orchestrates pre-defined alert rules (grouping, deduplicating) into (multiple) output channels
-
Grafana is the so-called "presentation layer" of the stack. To be able to monitor the environment, a person would only have to have access here.
These components have a fixed version set, related to the interoperability between them and not to run into issues by using version "latest".
| Check the Release Notes for specific version information. |
| Prometheus is by default DISABLED for a local setup |
Mechanics
| YAML is based around indentation, one space too many or little and the entire configuration file will be deemed "corrupt". If this happens, the error isn’t really explicit, as it will not be able to precisely explain where this has happened (ie. give the wrong line number in the configuration file). Be sure to have an equivalent to "show whitespaces" setting enabled when editing these types of files. |
Metric retrieval
Prometheus leverages a so-called "pull mechanism", meaning that defined "targets" (this list will be generated at start of Prometheus) will be "scraped" on a set interval. The storage of these series of scrapes is sequential on disk, in custom format. There is no requirement for the storage itself, as long as it’s fast enough to keep up with ingress. More information to be found here. The generic configuration (shortened here) for what to collect looks like this:
global:
  scrape_interval:     20s
  evaluation_interval: 20s

rule_files: ['/prometheus/config/rules/*.yml']

scrape_configs:
- job_name: 'broker'
  file_sd_configs:
  - files:
    - /prometheus/config/targets/broker/*.json
- job_name: 'vm'
  file_sd_configs:
  - files:
    - /prometheus/config/targets/vm/*.json
- job_name: 'cadvisor'
  file_sd_configs:
  - files:
    - /prometheus/config/targets/cadvisor/*.json
- job_name: 'prometheus'
  file_sd_configs:
    - files:
        - /prometheus/config/targets/prometheus/*.json
- job_name: 'PickAname'
  scheme: http
  metrics_path: /actuator/prometheus
  tls_config:
    insecure_skip_verify: true
  file_sd_configs:
  - files:
    - /prometheus/config/targets/PickAname/*.json
- job_name: 'custom-tenant-apps'
  file_sd_configs:
  - files:
    - /prometheus/config/targets/tenant-apps/*.json
The referenced JSON files are populated by the starting script, based upon cluster configuration files (ie. configurations are checked for enabled components). scrape_interval and evaluation_interval are set to similar timings, but can be altered (obviously). The setting rule_files is related to Alerting.
Due to previously mentioned components we can track performance of both performance (platform) and operations (software):
The port for the web interface of Prometheus is defined in the PROMETHEUS_PORT= setting in the configuration.
|
The list and status of endpoints is accessible through the web interface of Prometheus as well.
example:
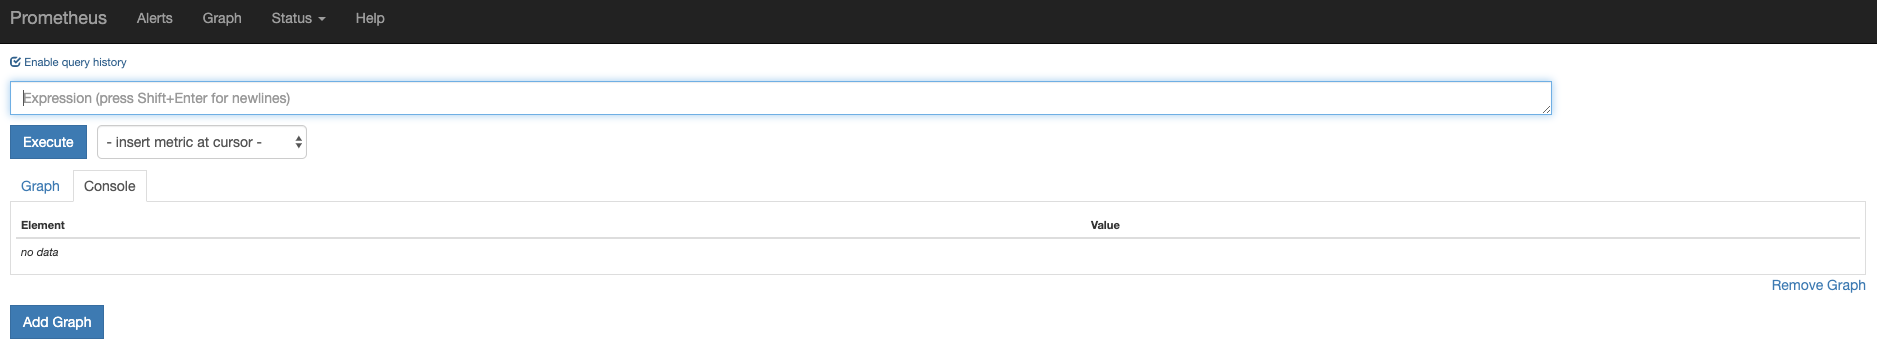
Metric generation
Host and Docker
The metrics themselves are also available through said web interface.
example:
results in a site where you can execute queries and get results in its raw data form.
The following query will determine whether or not an endpoint is available.
up{job="vm",instance=~"example.*"}| Element | Value |
|---|---|
up{axual_cluster="cluster-example",instance="example-mgmt-1.internal:port",job="vm"} |
1 |
up{axual_cluster="cluster-example",instance="example-worker-1.internal:port",job="vm"} |
1 |
up{axual_cluster="cluster-example",instance="example-worker-2.internal:port",job="vm"} |
1 |
up{axual_cluster="cluster-example",instance="example-worker-3.internal:port",job="vm"} |
1 |
up{axual_cluster="cluster-example",instance="example-worker-4.internal:port",job="vm"} |
0 |
up{axual_cluster="cluster-example",instance="example-worker-5.internal:port",job="vm"} |
1 |
up{axual_cluster="cluster-example",instance="example-worker-6.internal:port",job="vm"} |
0 |
1 means an endpoint is working, 0 means it’s not.
The next example shows the number of Open File Descriptors (which is a very important metric, unable to open new files will make a cluster stop COMPLETELY):
process_open_fds{job="broker"} / process_max_fds{job="broker"} * 100| Element | Value |
|---|---|
{axual_cluster="cluster-example",instance="example-worker-1.internal:port",job="broker"} |
3.018474578857422 |
Here it is shown that the component "broker" is using roughly 3% of its maximum amount of open file descriptors.
Axual Components
Aside of the mentioned host- and Docker-metrics, all java-based components in the Axual setup have built-in monitoring endpoints, either through a prometheus agent or micrometer dependency, which can be enabled through the settings <component>_PROMETHEUS_ENABLED=. This setting is also used to determine the lists of targets to be scraped from the Prometheus point of view. This leads to insight into the entire stack.
avg by(axual_cluster) (kafka_network_RequestMetrics_99thPercentile{name="TotalTimeMs",request="FetchFollower"})| Element | Value |
|---|---|
{axual_cluster="cluster-example1"} |
547.2866666666669 |
{axual_cluster="cluster-example2"} |
551.345 |
The results show that in both clusters, the 99 percentile of the Total time spent handling "Fetchfollower" requests (eg. other brokers catching up with partition leaders), is roughly 0.5 seconds (550ms).
Available metrics
Each endpoint defined (ie. with the setting <component>_PROMETHEUS_ENABLED= set to true, plus cAdvisor and Node exporter which are always enabled), is also directly accessible on the same url that Prometheus uses and will present the full list of metrics that are "exposed".
For example, the url
shows this:
# HELP jmx_config_reload_failure_total Number of times configuration have failed to be reloaded.
# TYPE jmx_config_reload_failure_total counter
jmx_config_reload_failure_total 0.0
# HELP jvm_buffer_pool_used_bytes Used bytes of a given JVM buffer pool.
# TYPE jvm_buffer_pool_used_bytes gauge
jvm_buffer_pool_used_bytes{pool="direct",} 3.4966002E7
jvm_buffer_pool_used_bytes{pool="mapped",} 1.05050053816E11
...
{omitted}
...
We’re not going to list them all, as that’s far too much information.
The metrics that are available are listed here.
Syntax
The registered mbeans and recorded metrics carry the same names, but using different syntaxes.
Mbean:
kafka.server:type=BrokerTopicMetrics,name=MessagesInPerSecMetrics:
kafka_server_BrokerTopicMetrics_Count{name="MessagesInPerSec",topic=dummy,}
kafka_server_BrokerTopicMetrics_FifteenMinuteRate{name="MessagesInPerSec",topic=dummy,}
kafka_server_BrokerTopicMetrics_FiveMinuteRate{name="MessagesInPerSec",topic=dummy,}
kafka_server_BrokerTopicMetrics_MeanRate{name="MessagesInPerSec",topic=dummy,}
kafka_server_BrokerTopicMetrics_OneMinuteRate{name="MessagesInPerSec",topic=dummy,}
Data retention
By default, the prometheus database has a retention of 14 days, which is determined through the setting PROMETHEUS_STORAGE_RETENTION=, for instance
PROMETHEUS_STORAGE_RETENTION=336hBased on monitoring requirements and provisioning, this can be increased, where the required space would be:
needed_disk_space = retention_time_seconds * ingested_samples_per_second * bytes_per_samplebased on this rule of thumb where an average sample is between 1 and 2 bytes in size
Data presenation
Metrics in and by itself are VAST, it would be impossible to interpret this plain-text, so we need a tool to plot out items versus time. Prometheus can do this itself, but Grafana by far exceeds the range of possibilities, the most important being able to leverage an advanced authentication/authorization model.
| The key to monitoring is to determine WHAT you want to know, before you start building dashboards. |